Branch color at branch
Introduction
The function of the DATASET_STYLE template is to adjust the style of branches at any level. It includes two subclasses: branch and label. The function parameter is simple, whereas the input data is more complex. The DATASET_STYLE template belongs to the “Style” class (refer to the Class for detail information).
Typically, users define a branch or node style by entering the branch or node name, subclass function name, action location, color, font or line style, and size. The selected branch will be displayed in new style changes specified by the sub function. This function has a high level of integration, and its data parameters are relatively complex, posing a great challenge to users.
Adjust style
This section uses dataset 1 as an example to show how to adjust the styles. (refer to the Dataset for detail information)
Load data
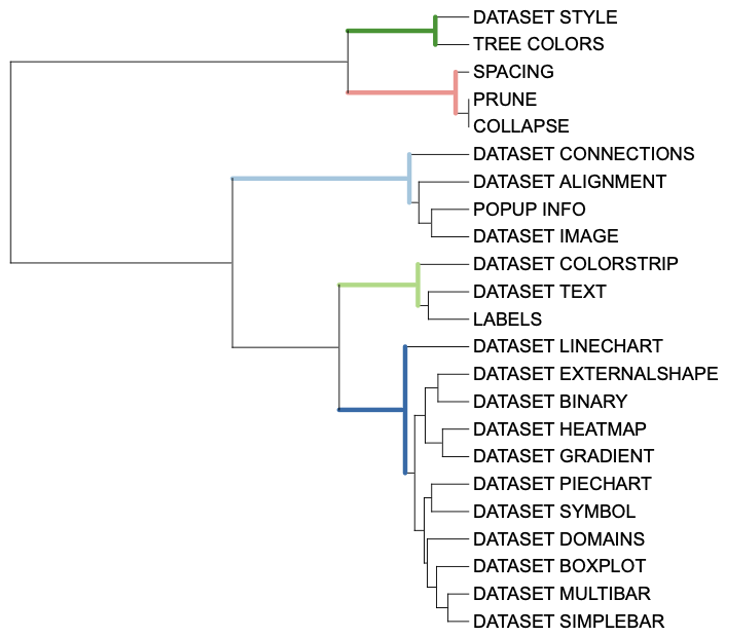
The first step is to load the newick format tree file tree_of_itol_templates.tree and its corresponding metadata df_frequence.
library(itol.toolkit)
tree <- system.file("extdata",
                    "tree_of_itol_templates.tree",
                    package = "itol.toolkit")
data("template_groups")
df_data <- data.frame(id = unique(template_groups$group),
                      data = unique(template_groups$group))
We can use the “branch” subtype function to adjust the color of the node area. In E013, we only used two columns of information to implement the function. There is no location defined here, and the program defaults to the node location. Other parameters are consistent with E012. If you simplify it further, when the line thickness is 1, the size parameter can also be omitted and not written.
unit_13 <- create_unit(data = df_data,
                       key = "E013_style_2",
                       type = "DATASET_STYLE",
                       subtype = "branch",
                       size_factor = 5,
                       tree = tree)
write_unit(unit_13)