library(itol.toolkit)
library(data.table)
tree_2 <- "~/Downloads/itol.annotation-package.output/10.1016j.envpol.2022.120243/Fig.3/Rare-tree/rare-tree.nwk"
hub_2 <- create_hub(tree_2)
data_file_2 <- "~/Downloads/itol.annotation-package.output/10.1016j.envpol.2022.120243/Fig.3/Rare-tree/metadata.txt"
data_2 <- data.table::fread(data_file_2)
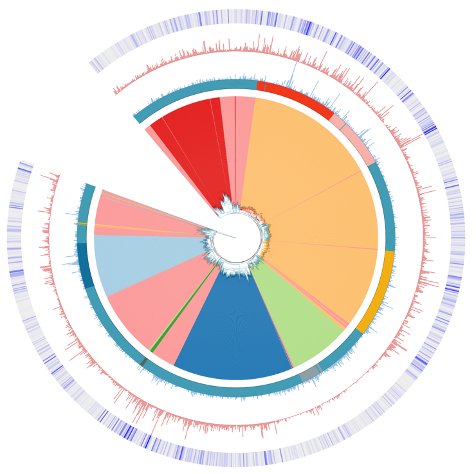
# relabel by genus
unit_7 <- create_unit(data = data_2 %>% select(ID, Genus),
key = "rep_Zheng2022ep_3ar_1_labels",
type = "LABELS",
tree = tree_2)
# tree_colors range by phylum
unit_8 <- create_unit(data = data_2 %>% select(ID, Phylum),
key = "rep_Zheng2022ep_3ar_2_range",
type = "TREE_COLORS",
subtype = "range",
tree = tree_2)
# color_strip by class
set.seed(123)
unit_9 <- create_unit(data = data_2 %>% select(ID, Class),
key = "rep_Zheng2022ep_3ar_3_strip",
type = "DATASET_COLORSTRIP",
color = "wesanderson",
tree = tree_2)
unit_9@common_themes$basic_theme$margin <- 50
# simple_bar by NS
unit_10 <- create_unit(data = data_2 %>% select(ID, NS),
key = "rep_Zheng2022ep_3ar_4_simplebar",
type = "DATASET_SIMPLEBAR",
tree = tree_2)
unit_10@specific_themes$basic_plot$size_max <- 100
# simple_bar by OS
unit_11 <- create_unit(data = data_2 %>% select(ID, OS),
key = "rep_Zheng2022ep_3ar_5_simplebar",
type = "DATASET_SIMPLEBAR",
tree = tree_2)
unit_11@specific_themes$basic_plot$size_max <- 100
# simple_bar by OS
unit_12 <- create_unit(data = data_2 %>% select(ID, Dissimilarity),
key = "rep_Zheng2022ep_3ar_6_gradient",
type = "DATASET_GRADIENT",
tree = tree_2)
#unit_6@specific_themes$heatmap$color$min <- "#0000ff"
#unit_6@specific_themes$heatmap$color$max <- "#ff0000"
hub_2 <- hub_2 +
unit_7 +
unit_8 +
unit_9 +
unit_10 +
unit_11 +
unit_12
write_hub(hub_2,getwd())
 library(data.table) tree_2 <- )