PRUNE by tip & node id
Introduction
The function of the PRUNE template is to select branches. The PRUNE template belongs to the “Tree structure” class (refer to the Class for detail information).
Generally, users can select one branch or all branches within a node by entering the branch or node name. The selected branch will be included in the new phylogenetic tree, while the unselected branch will be excluded. This function is the only template function that changes the number of branches.
This section shows how to select branches in itol.toolkit. The process is very simple, and the main difficulty is that the user needs to determine which branches to be filtered. Without itol.toolkit, users have to perform data analysis and visualization preparation in fragmented environments. The itol.toolkit provides consistency to the workflow, allowing users to filter branches and output template files seamlessly.
Prune nodes
This section uses dataset 1 as an example. (refer to the Dataset for detail information)
The first step is to load the newick format tree file tree_of_itol_templates.tree and its corresponding metadata df_frequence and template_parameters_count.
The purpose of data processing in this section is to demonstrate how to select labels to be pruned according to users’ demands.
library(itol.toolkit)
tree <- system.file("extdata",
                    "tree_of_itol_templates.tree",
                    package = "itol.toolkit")
df_frequence <- data.table::fread(system.file("extdata",
                                              "templates_frequence.txt",
                                              package = "itol.toolkit"))
data("template_parameters_count")
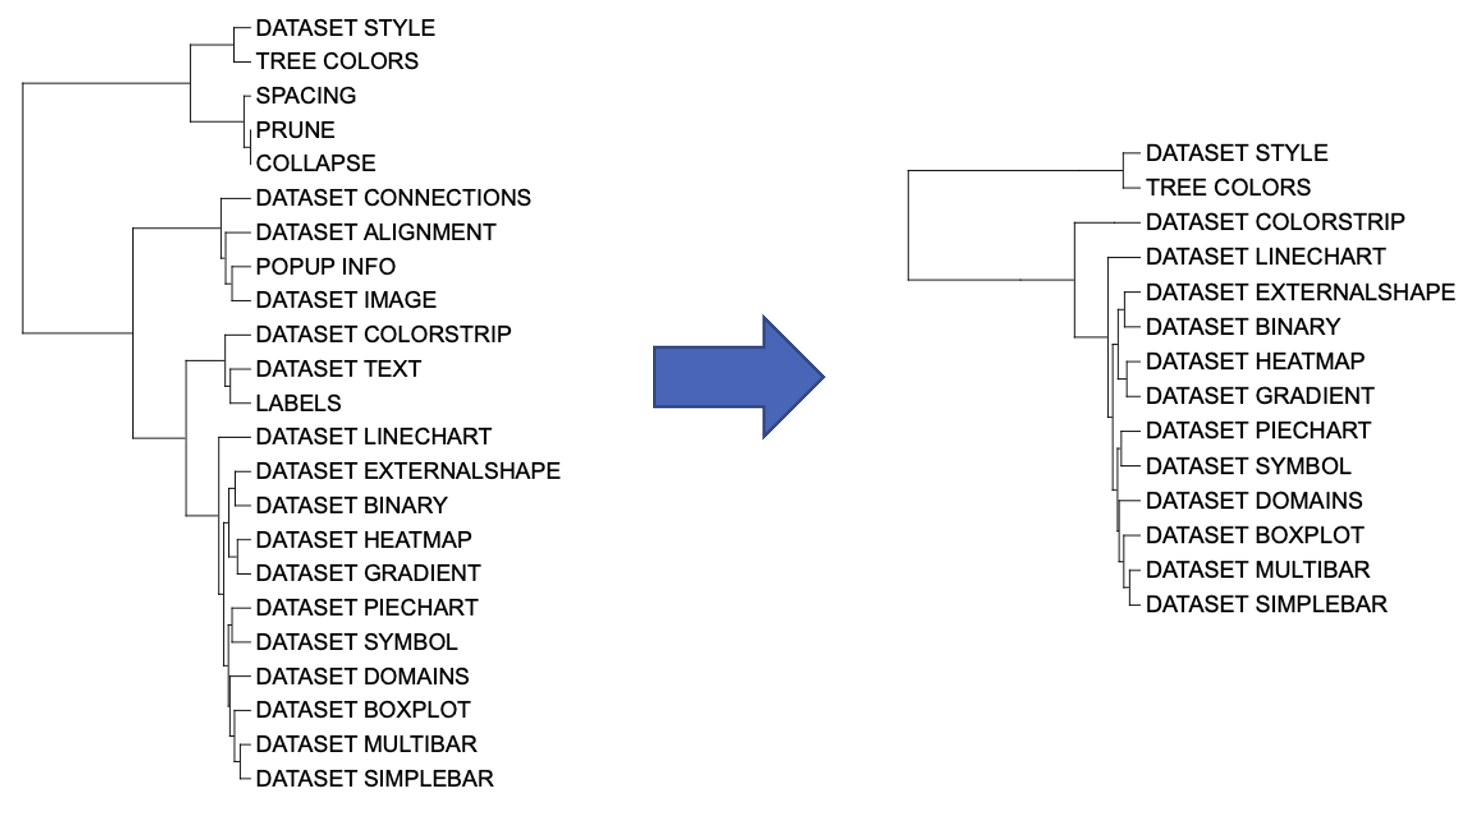
We can use both node and branch names to filter branches. For example, select the two types of templates that are most commonly used and have the most complex parameters: “theme_style” and “basic_plot”.
ids <- df_frequence$templates
df_frequence[df_frequence > 1] <- 1
df_frequence$templates <- ids
most_used_tip = df_frequence$templates[which.max(rowSums(df_frequence[,-1],
                                                         na.rm = T))]
select_item = c(most_used_tip, "theme_style","basic_plot")
unit_3 <- create_unit(data = select_item,
                      key = "E003_prune_1",
                      type = "PRUNE",
                      tree = tree)
write_unit(unit_3)