Branch color at branch
Introduction
The TREE_COLORS allows you to set the style of branches at any level. It has five attributes: “range”, “clade”, “branch”, “label”, and “label_background”. While style parameters is simple of TREE_COLORS, the data parameters are extremely complex. The Style template belongs to the “Tree structure” class (refer to the Class for detail information).
To set the style of a branch or node, users must enter the name of the branch tip or node and the attribute such as color, label, style, and size.The selected branch will then display the new styles as defined by the specified attribute. Although this function provides the most comprehensive templates for modifying tree style, its complexity in data parameters proves to be a great challenge for users.
This section shows how to use itol.toolkit to modify the style. The itol.toolkit significantly reduces the difficulty level for using iTOL by enabling automatic data recognition. Without itol.toolkit, users would have to organize various attribute parameters and their corresponding input data manually. With the itol.toolkit, the entire workflow becomes more cohesive, and users can directly output the template files once they have confirmed which data to use.
Regular flow
This section uses dataset 1 as an example to show how to draw the line chart. (refer to the Dataset for detail information)
Load data
The first step is to load the newick format tree file tree_of_itol_templates.tree and its corresponding metadata df_frequence.
library(itol.toolkit)
tree <- system.file("extdata",
                    "tree_of_itol_templates.tree",
                    package = "itol.toolkit")
hub <- create_hub(tree = tree)
data("template_groups")
If the user enters all four columns, the program will figure out which is the subclass and which is the color.
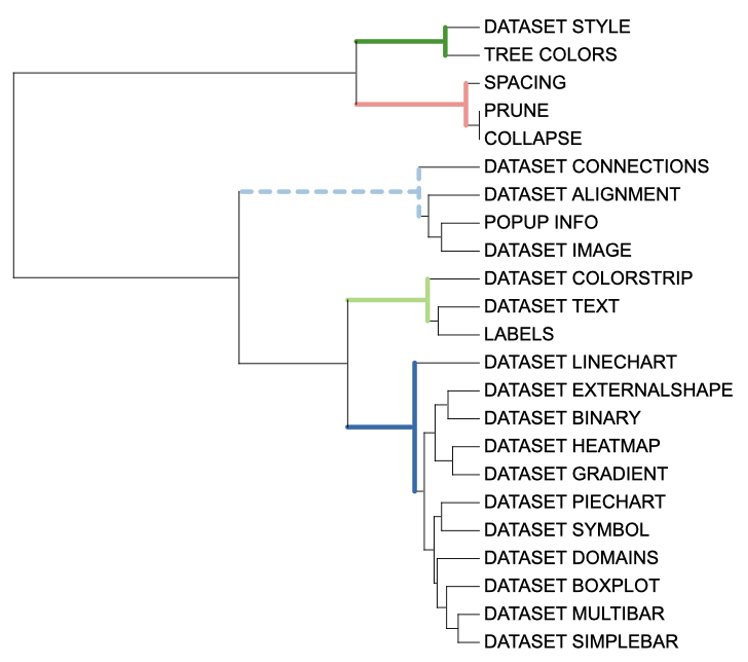
We can use the “branch” attribute to adjust color of the node or tip like “clade” attribute. However, “branch” attribute does not broadcast these settings to its offspring branches. See unit_9
unit_9 <- create_unit(data = df_data,
                      key = "E009_tree_colors_3",
                      type = "TREE_COLORS",
                      subtype = "branch",
                      line_type = c(rep("normal",4),"dashed"),
                      size_factor = 5,
                      tree = tree)
write_unit(unit_9)