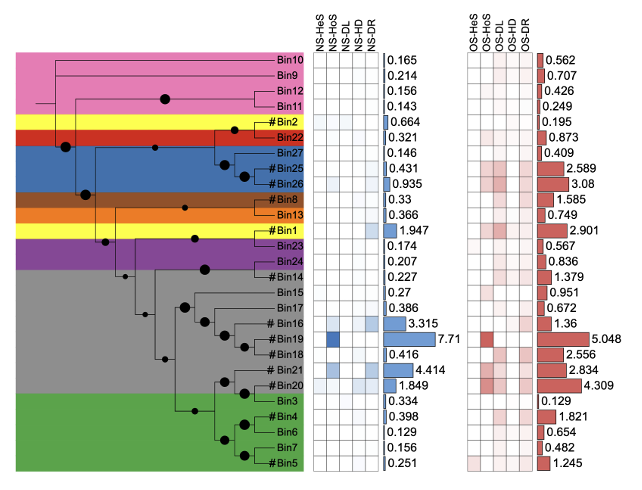
iCAMP
DOI: 10.1016/j.envpol.2022.120243
Figure 4
library(itol.toolkit)
library(data.table)

tree_3 <- "https://raw.githubusercontent.com/TongZhou2017/itol.toolkit/master/inst/extdata/dataset3/assembly-tree.nwk"
hub_3 <- create_hub(tree_3)
data_file_3 <- "https://raw.githubusercontent.com/TongZhou2017/itol.toolkit/master/inst/extdata/dataset3/assembly-metadata.txt"
data_3 <- data.table::fread(data_file_3)

# tree_colors range by phylum
unit_13 <- create_unit(data = data_3 %>% select(ID, Phylum),
                    key = "rep_Zheng2022ep_4a_1_range",
                    type = "TREE_COLORS",
                    subtype = "range",
                    tree = tree_3)
write_unit(unit_13,
           paste0(getwd(),"/rep_Zheng2022ep_4a_2_range.txt"))

top_10_NS <- data_3 %>% select(ID,`NS-bar`) %>% arrange(desc(`NS-bar`)) %>% head(n=10) %>% pull(ID)
top_10_OS <- data_3 %>% select(ID,`OS-bar`) %>% arrange(desc(`OS-bar`)) %>% head(n=10) %>% pull(ID)
RA_1 <- data_3 %>% mutate(pct = `OS-bar`+`NS-bar`/sum(data_3$`OS-bar`,data_3$`NS-bar`)) %>% select(ID, pct) %>% arrange(pct) %>% filter(pct > 1) %>% pull(ID)
RA_ids <- unique(c(top_10_NS,top_10_OS,RA_1))
df_text <- data.frame(id = RA_ids, text = rep("#",length(RA_ids)))
unit_14 <- create_unit(data = df_text,
                       key = "rep_Zheng2022ep_4a_3_text",
                       type = "DATASET_TEXT",
                       size_factor = 1,
                       position = 0.9,
                       rotation=0,
                       color = "#000000",
                       tree = tree_3)
write_unit(unit_14,
           paste0(getwd(),"/rep_Zheng2022ep_4a_3_text.txt"))

df_cap_NS <- data_3 %>% select(ID, starts_with("NS"))
df_bar_NS <- df_cap_NS %>% select(ID,ends_with("bar"))
df_cap_NS <- df_cap_NS %>% select(-ends_with("bar"))
unit_15 <- create_unit(data = df_cap_NS,
                       key = "rep_Zheng2022ep_4a_4_heatmap",
                       type = "DATASET_HEATMAP",
                       tree = tree_3)
write_unit(unit_15,
           paste0(getwd(),"/rep_Zheng2022ep_4a_4_heatmap.txt"))

# simple_bar by OS
df_bar_NS$`NS-bar` <- round(df_bar_NS$`NS-bar`,3)
unit_16 <- create_unit(data = df_bar_NS,
                      key = "rep_Zheng2022ep_4a_6_simplebar",
                      type = "DATASET_SIMPLEBAR",
                      tree = tree_3)
unit_16@specific_themes$basic_plot$size_max <- 100
write_unit(unit_16,
           paste0(getwd(),"/rep_Zheng2022ep_4a_6_simplebar.txt"))

df_cap_OS <- data_3 %>% select(ID, starts_with("OS"))
df_bar_OS <- df_cap_OS %>% select(ID,ends_with("bar"))
df_cap_OS <- df_cap_OS %>% select(-ends_with("bar"))
unit_17 <- create_unit(data = df_cap_OS,
                       key = "rep_Zheng2022ep_4a_7_heatmap",
                       type = "DATASET_HEATMAP",
                       tree = tree_3)
write_unit(unit_17,
           paste0(getwd(),"/rep_Zheng2022ep_4a_7_heatmap.txt"))

# simple_bar by OS
df_bar_OS$`OS-bar` <- round(df_bar_OS$`OS-bar`,3)
unit_18 <- create_unit(data = df_bar_OS,
                      key = "rep_Zheng2022ep_4a_8_simplebar",
                      type = "DATASET_SIMPLEBAR",
                      tree = tree_3)
unit_18@specific_themes$basic_plot$size_max <- 100
write_unit(unit_18,
           paste0(getwd(),"/rep_Zheng2022ep_4a_8_simplebar.txt"))