DATASET_BINARY
Weiyue Liu1, Zhongyi Hua2, Tong Zhou3
Last compiled on 01 September, 2025
DATASET_BINARY.RmdIntroduction
The function of DATASET_BINARY template is to visualize
binary datasets as outlined or filled symbols. The
DATASET_BINARY template belongs to the “Basic graphics”
class (refer to the Class for detail information).
Typically, users visualize binary datasets as outlined or filled symbols by entering branch/node names and metadata, where 1 corresponds to a filled shape, 0 corresponds to a outlined shape, and - 1 corresponds to a completely omitted shape.
This section shows how to use DATASET_BINARY template to
visualize binary datasets. Without itol.toolkit, users need
to manually set subtype parameters and enter data. The
itol.toolkit makes the entire workflow coherent, allowing
users to process data in R environment and directly output the
template.
Draw symbols
This section uses dataset 1 as an example to show the visualization of binary data in different types of trees (refer to the Dataset.
The first step is to load the newick format tree file
tree_of_itol_templates.tree and its corresponding metadata
template_frequence.
library(itol.toolkit)
library(data.table)
library(ape)
tree <- system.file("extdata",
                    "tree_of_itol_templates.tree",
                    package = "itol.toolkit")
df_frequence <- system.file("extdata",
                    "templates_frequence.txt",
                    package = "itol.toolkit")
The metadata is processed to convert the usage frequency to binary data. We use 1 to indicate that the template type is used in the article, and 0 to indicate that the template type is not used in the article.
df_frequence <- fread(df_frequence)
# assign 0 to missing values (unused template types)
df_frequence[is.na(df_frequence)] <- 0
# save the template type column in a variable to prevent overwriting in subsequent assignments
ids <- df_frequence$templates
# assign 1 to values > 0 (used template types)
df_frequence[df_frequence>0] <- 1
# rewrite the overwritten template type column
df_frequence$templates <- ids
# replace spaces in column names with "_" to prevent errors
names(df_frequence) <- stringr::str_replace_all(names(df_frequence)," ","_")
We can use the DATASET_BINARY template to visualize
binary dataset as outlined or filled circles.We can adjust the size of
the symbols through
unit@specific_themes$basic_plot$height_factor.
unit_24 <- create_unit(data = df_frequence,
                       key = "E024_binary_1",
                       type = "DATASET_BINARY",
                       tree = tree)
unit_24@specific_themes$basic_plot$height_factor <- 0.4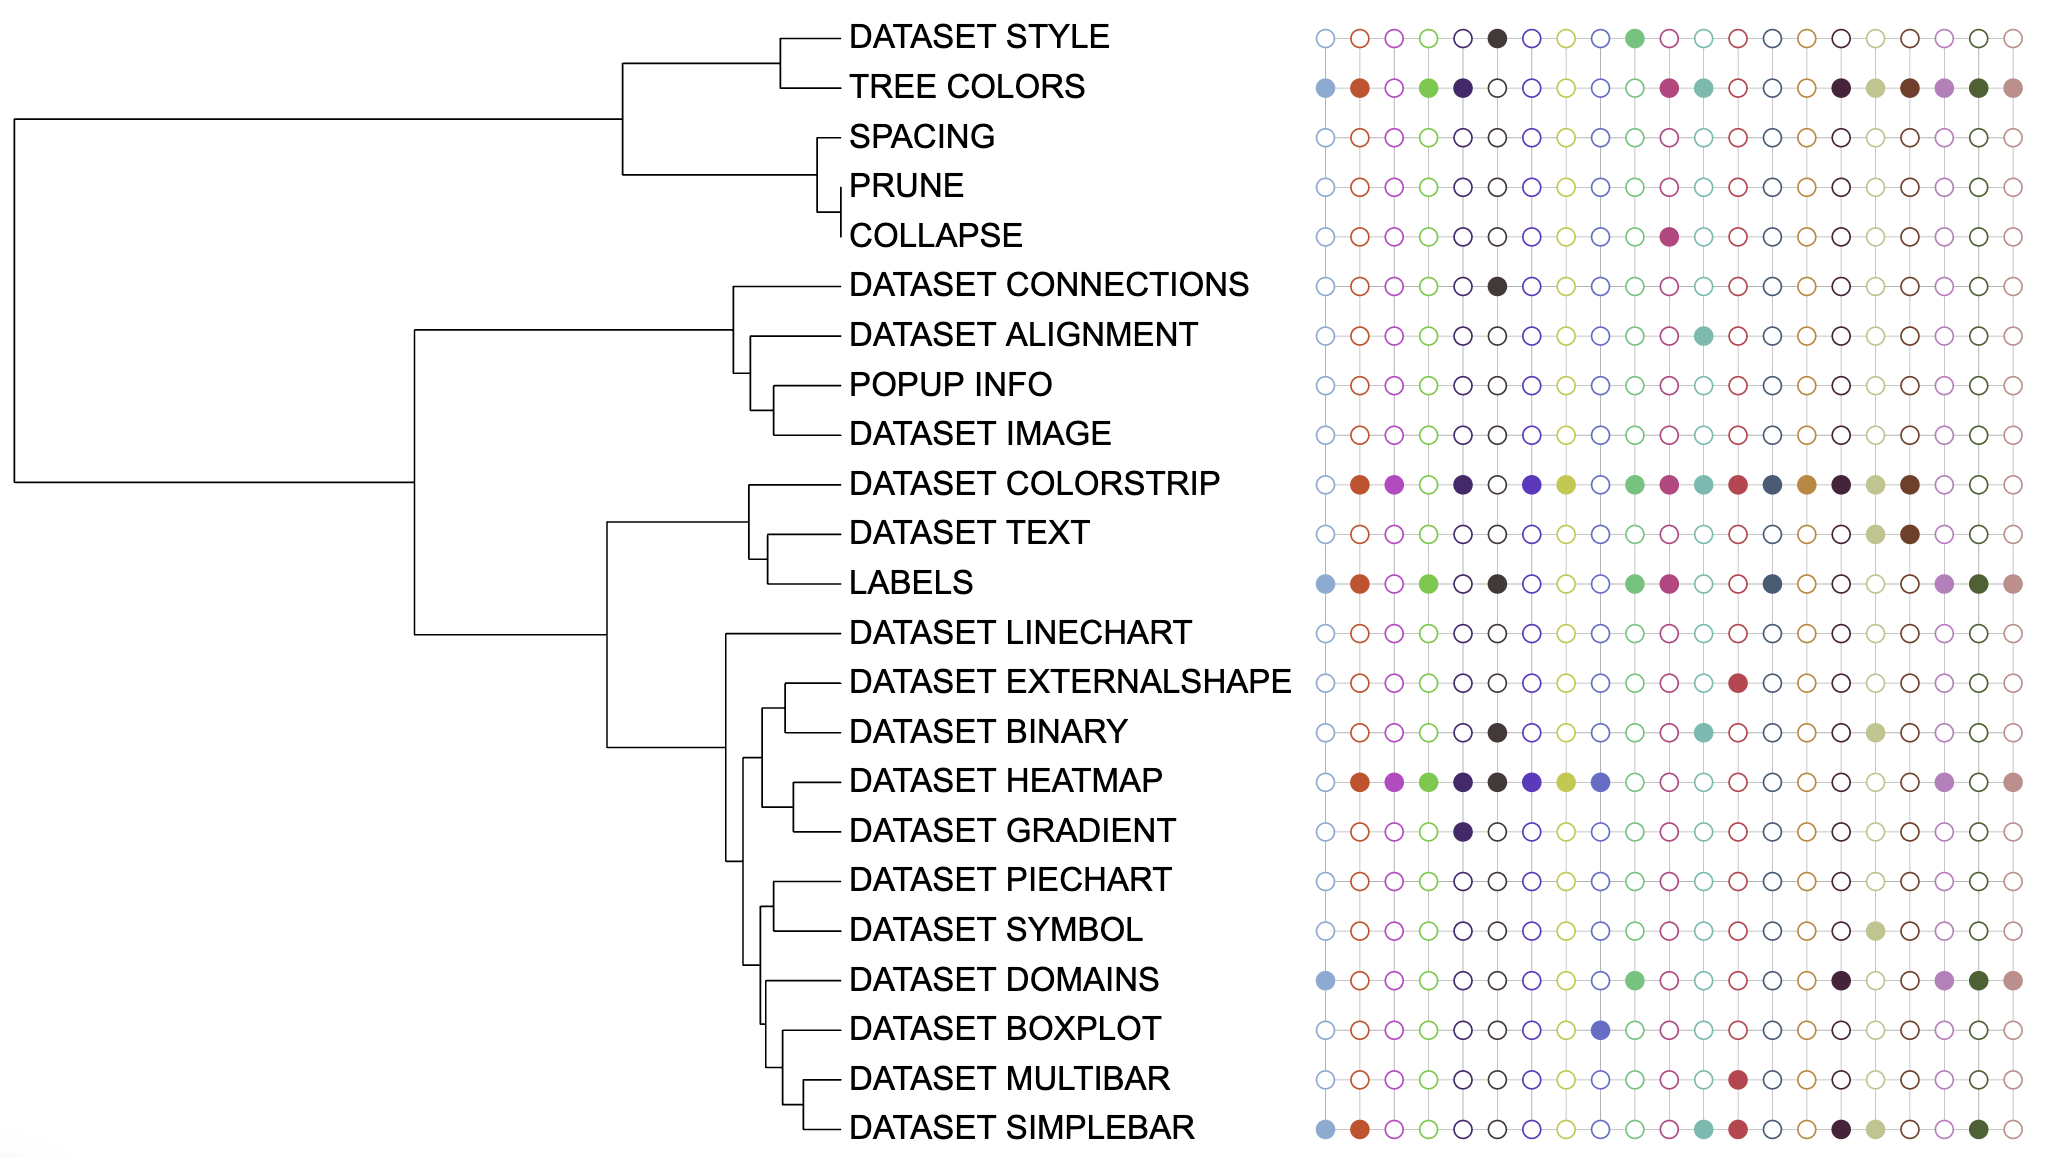
Binary dataset visualization example 1
It is worth noting that the same symbol size will be displayed
differently in different tree shapes. Therefore, here we create symbols
suitable for a rectangular tree by adjusting
unit@specific_themes$basic_plot$height_factor to 0.8. We
can add labels to the symbols through
unit@common_themes$label$display.
unit_25 <- create_unit(data = df_frequence,
                       key = "E025_binary_2",
                       type = "DATASET_BINARY",
                       tree = tree)
unit_25@specific_themes$basic_plot$height_factor <- 0.8
unit_25@common_themes$label$display <- 1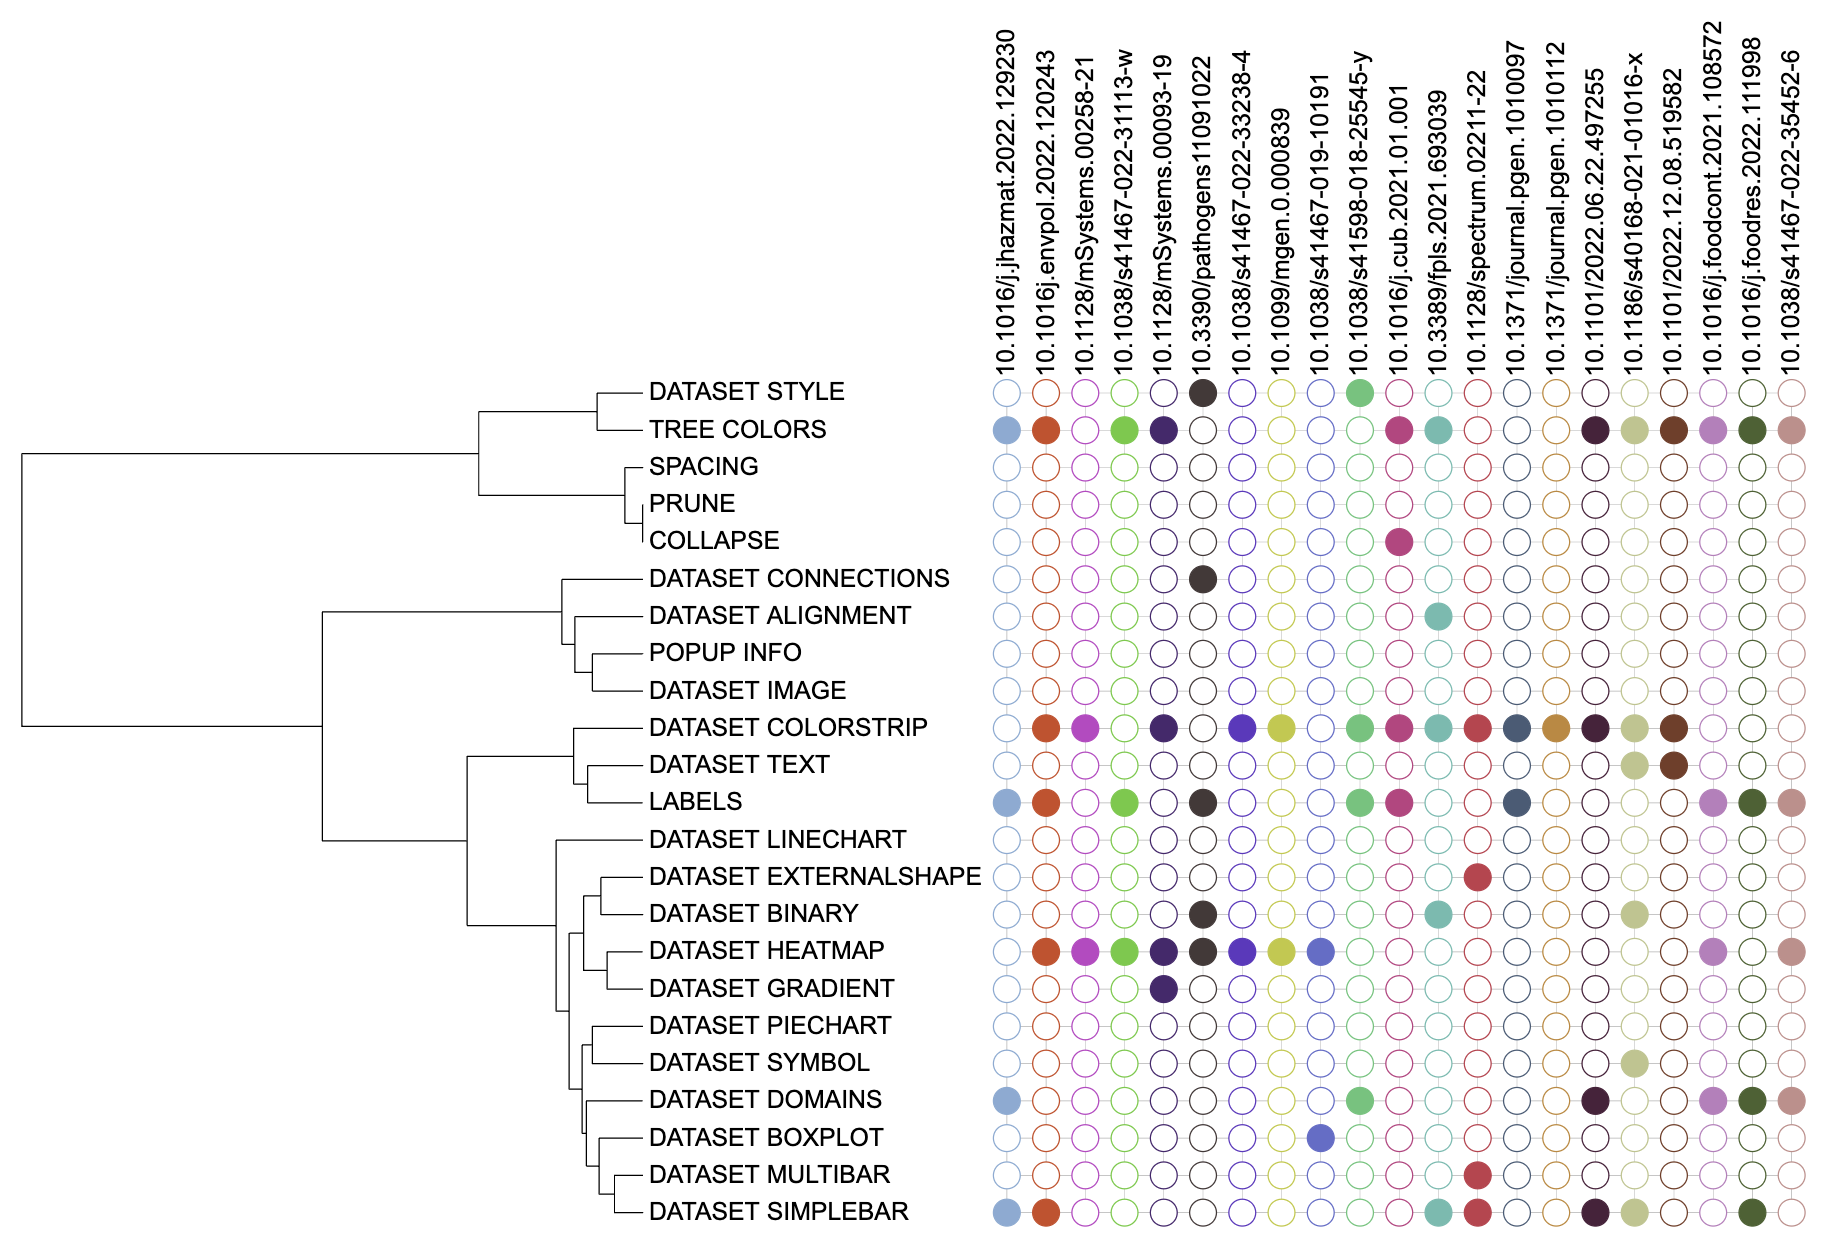
Binary dataset visualization example 2