DATASET_SIMPLEBAR
Longzhao Li1, Zhongyi Hua2, Tong Zhou3
Last compiled on 01 September, 2025
DATASET_SIMPLEBAR.RmdIntroduction
The DATASET_SIMPLEBAR template is to draw the simple bar
charts and store corresponding numeric value. The
DATASET_SIMPLEBAR template belongs to the “Basic graphics”
class (refer to the Class for detail information).
In simple bar chart, each tree node is associated to a single numeric value, which is displayed as a bar outside the tree. This value is typically statistics derived from raw data, such as the average and sum. Unfortunately, iTOL does not support statistical analysis, making it necessary for users to use other tools to perform such analysis. Additionally, the raw data was excluded in iTOL templates, posing difficulties in reproducing pictures or sharing them with others.
Here, itol.toolkit provide a convenient way to calculate
statistics of simple bar charts. This section describes
how to use itol.toolkit to prepare the simple bar chart
templates.
This section uses dataset 1 as an example to show how to draw the Simple bar charts. (refer to the Dataset for detail information)
Load data
The first step is to load the newick format tree file
tree_of_itol_templates.tree and its corresponding metadata
df_frequence.
library(itol.toolkit)
library(data.table)
library(tidyr)
library(dplyr)
library(stringr)
library(ape)
tree <- system.file("extdata",
                    "tree_of_itol_templates.tree",
                    package = "itol.toolkit")
df_frequence <- system.file("extdata",
                            "templates_frequence.txt",
                             package = "itol.toolkit")
df_frequence <- fread(df_frequence)
names(df_frequence) <- c(
  "id",
  "Li,S. et al. (2022) J. Hazard. Mater.","Zheng,L. et al. (2022) Environ. Pollut.",
  "Welter,D.K. et al. (2021) mSystems",
  "Zhang,L et al. (2022) Nat. Commun.",
  "Rubbens,P. et al. (2019) mSystems",
  "Laidoudi,Y. et al. (2022) Pathogens",
  "Wang,Y. et al. (2022) Nat. Commun.",
  "Ceres,K.M. et al. (2022) Microb. Genomics",
  "Youngblut,N.D. et al. (2019) Nat. Commun.",
  "Balvín,O. et al. (2018) Sci. Rep.",
  "Prostak,S.M. et al. (2021) Curr. Biol.",
  "Dijkhuizen,L.W. et al. (2021) Front. Plant Sci.",
  "Zhang,X. et al. (2022) Microbiol. Spectr.",
  "Peris,D. et al. (2022) PLOS Genet.",
  "Denamur,E. et al. (2022) PLOS Genet.",
  "Dezordi,F.Z. et al. (2022) bioRxiv",
  "Lin,Y. et al. (2021) Microbiome",
  "Wang,Y. et al. (2022) bioRxiv",
  "Qi,Z. et al. (2022) Food Control",
  "Zhou,X. et al. (2022) Food Res. Int.",
  "Zhou,X. et al. (2022) Nat. Commun.")
names(df_frequence) <- stringr::str_remove_all(names(df_frequence),"[()]")
names(df_frequence) <- stringr::str_replace_all(names(df_frequence),",","-")
Data processing and create the unit
Let’s say the user intends to calculate the sum of each template’s frequency in 21 articles as a basis for creating Simple bar charts. In the event that the user enters multiple columns of data without specifying a method, itol.toolkit will automatically use the sum method to process the data.
unit_35 <- create_unit(data = df_frequence,
                       key = "E035_simplebar_1",
                       type = "DATASET_SIMPLEBAR",
                       tree = tree)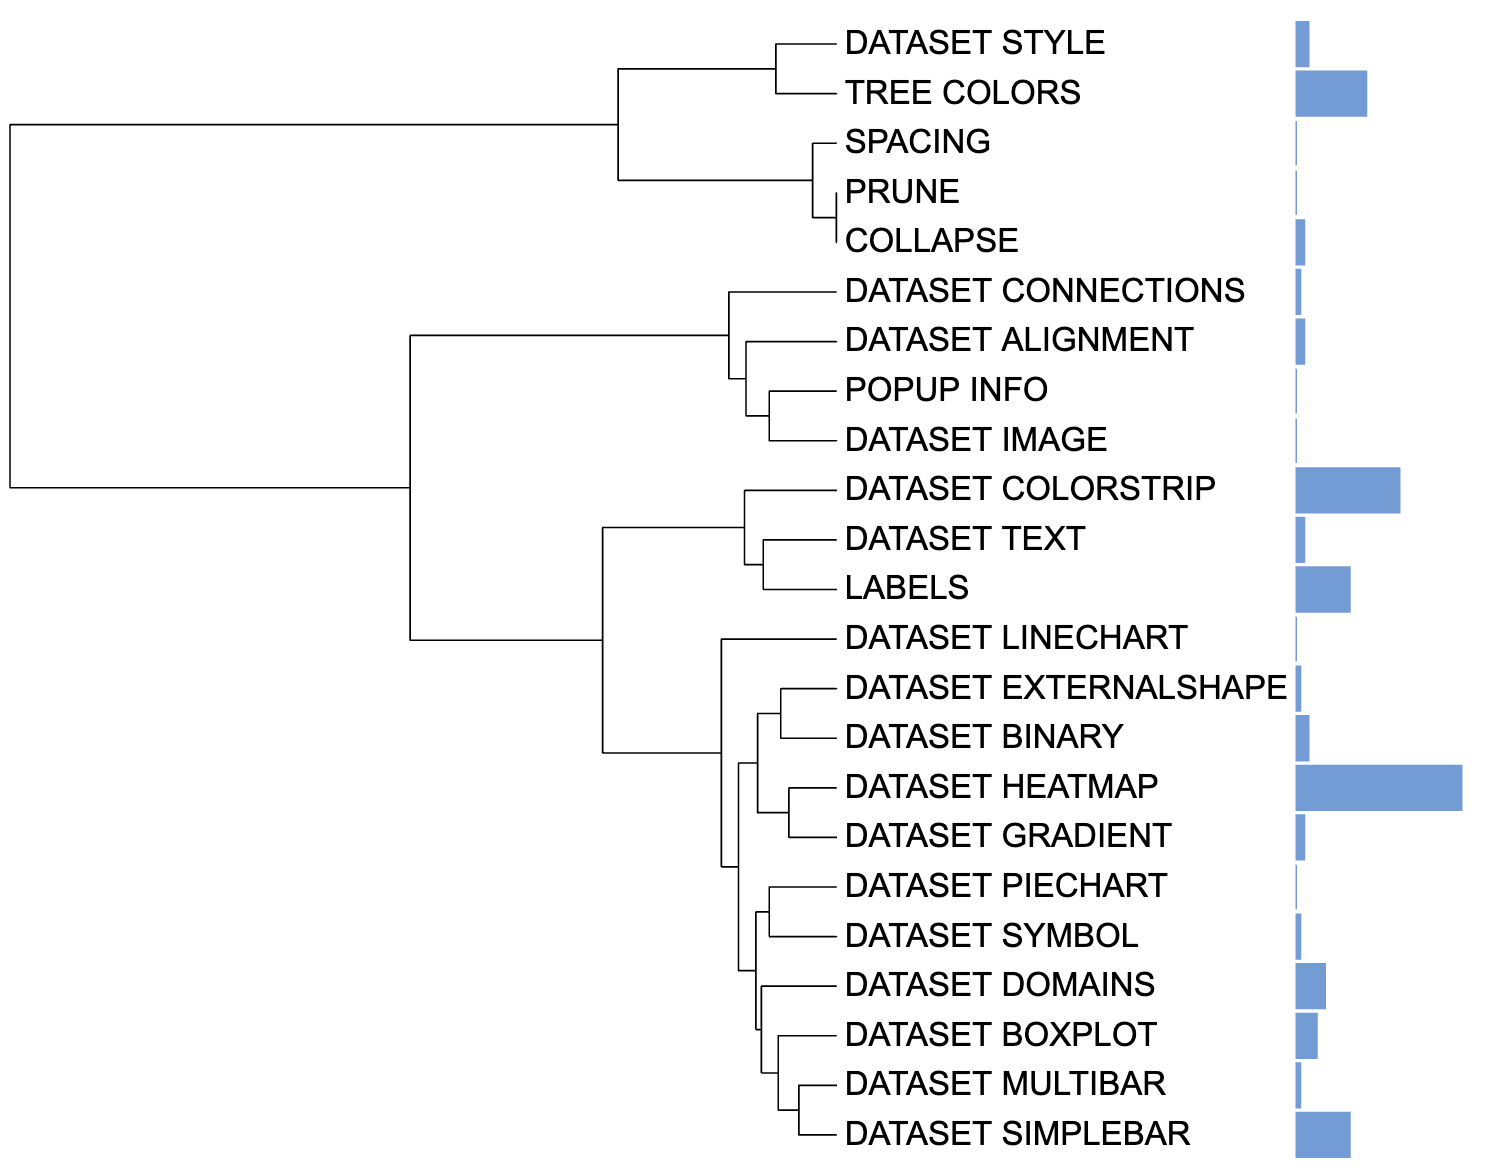
Simple bar chart visualization example
We can also calculate the average usage frequency of each template in
published articles by specifying the method parameter as
mean, and use this as a basis for drawing Simple bar
charts.
unit_36 <- create_unit(data = df_frequence,
                       key = "E036_simplebar_2",
                       type = "DATASET_SIMPLEBAR",
                       method = "mean",
                       tree = tree)