DATASET_GRADIENT
Weiyue Liu1, Zhongyi Hua2, Tong Zhou3
Last compiled on 01 September, 2025
DATASET_GRADIENT.RmdIntroduction
The function of DATASET_GRADIENT is to associate
specified tree nodes to numeric values, which is displayed as a colored
rectangle outside the tree. The DATASET_GRADIENT template
belongs to the “Basic graphics” class (refer to the Class
for detail information).
Typically, users would have to enter the leaf node name and the corresponding value in pairs to generate a colored rectangle outside the corresponding tip node. However, the raw data users need to process are usually to be the multi-column wide data (e.g. data from multiple biological replicates), which need users to calculate a statistic (e.g. average value). Thus, the data analysis and iTOL visualization preparation are separated without itol.toolkit.
This section shows how to use itol.toolkit to add corresponding
numerical values to tip nodes. Users can directly enter multi-column
data into itol.toolkit. The program will automatically
calculate statistics from input data using a batch of methods, making
the workflow of data analysis and visualization coherent. In general,
Users can determine data processing methods based on their needs and
output templates directly.
Visualize numerical information
This section uses dataset 1 as an example to show the visualization of binary data in different types of trees (refer to the Dataset.
The first step is to load the newick format tree file
tree_of_itol_templates.tree and its corresponding metadata
template_frequence. Briefly, the
templates_frequence contains the usage of each template
type in 21 published studies.
library(itol.toolkit)
library(data.table)
library(ape)
tree <- system.file("extdata",
                    "tree_of_itol_templates.tree",
                    package = "itol.toolkit")
df_frequence <- system.file("extdata",
                            "templates_frequence.txt",
                             package = "itol.toolkit")
df_frequence <- fread(df_frequence)
Suppose users want to sum the frequency of each template used in 21
articles, and visualizing it using gradient color, users could use
following codes. Notably, if users enter multiple columns of data and
does not specify a method, itol.toolkit uses the sum method
to process the data by default.
unit_26 <- create_unit(data = df_frequence,
                       key = "E026_gradient_1",
                       type = "DATASET_GRADIENT",
                       tree = tree)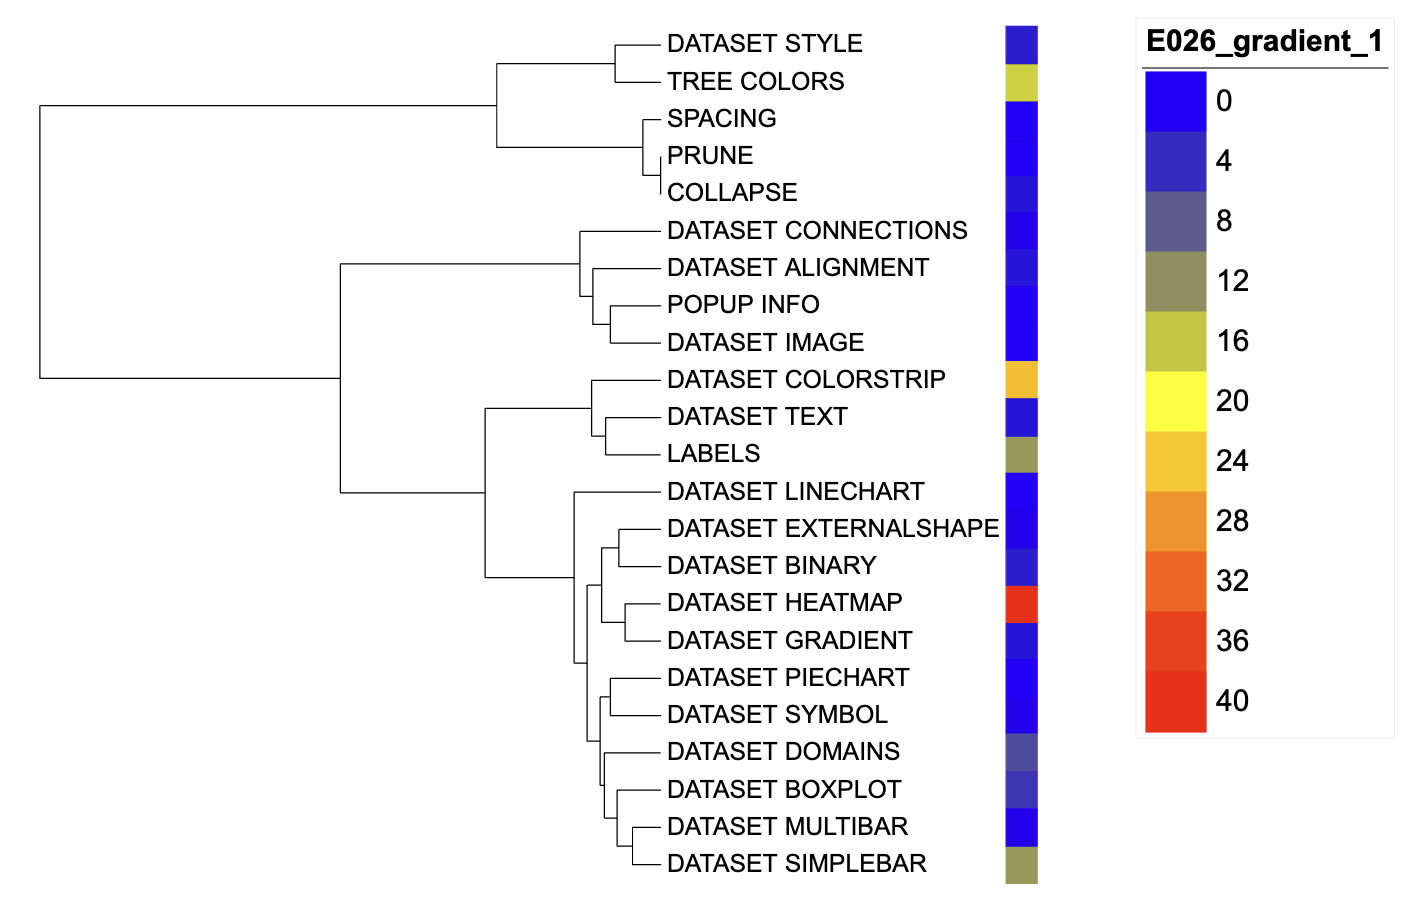
Gradient visualization example 1
We can also calculate the average usage frequency of each template in
published articles by specifying the method parameter as
mean, and use it in gradient coloring.
unit_27 <- create_unit(data = df_frequence,
                       key = "E027_gradient_2",
                       type = "DATASET_GRADIENT",
                       method = "mean",
                       tree = tree)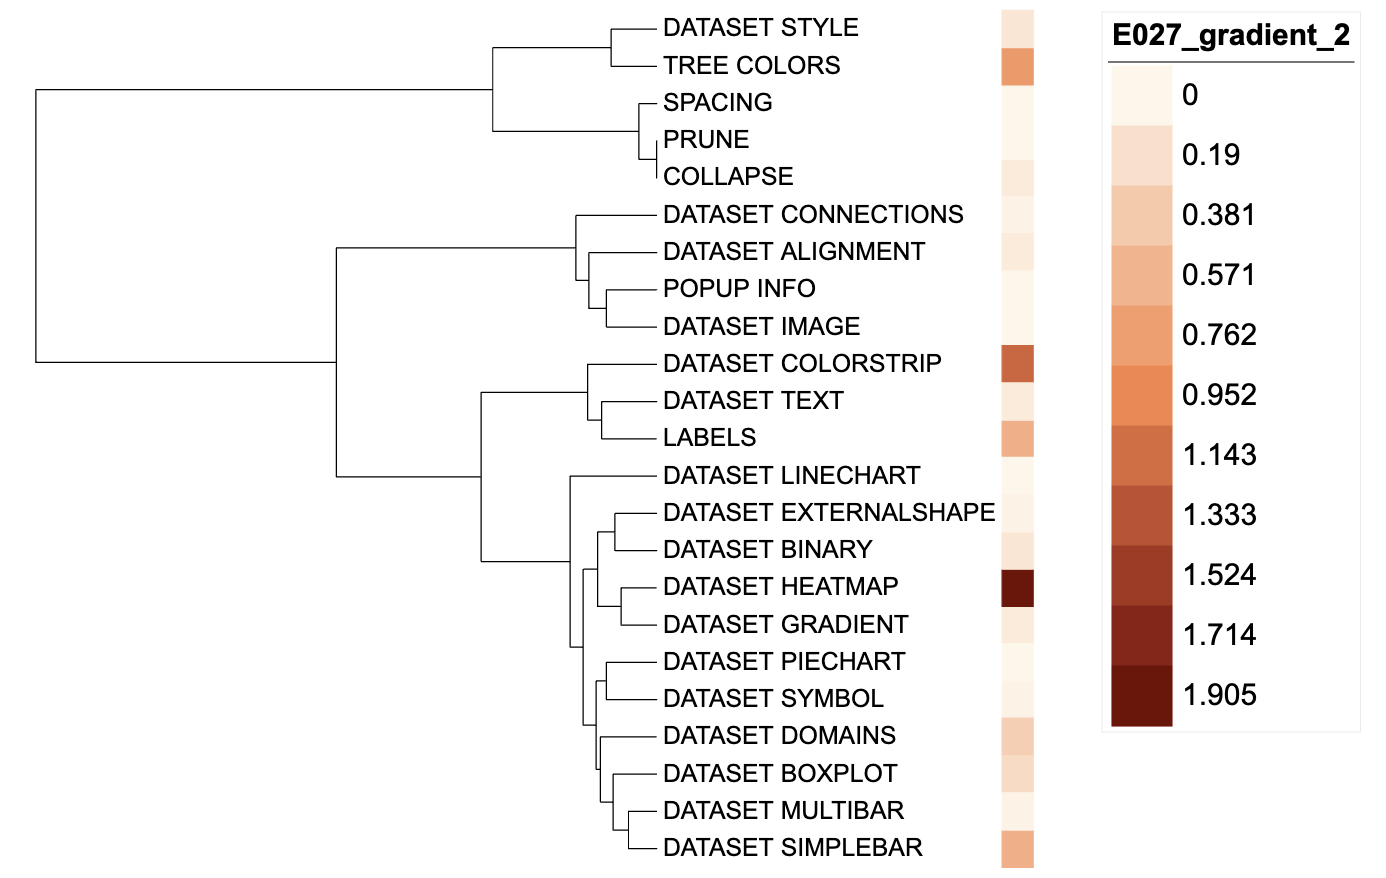
Gradient visualization example 2
Style modification
By adjusting unit@specific_themes$heatmap$color$min,
unit@specific_themes$heatmap$color$mid, and
unit@specific_themes$heatmap$color$max, users can customize
the color gradient of the rectangle. Here, we set different colors for
unit_23 and unit_24.
unit_26@specific_themes$heatmap$color$min <- "#0000ff"
unit_26@specific_themes$heatmap$color$max <- "#ff0000"

unit_27@specific_themes$heatmap$color$min <- "#FFF7ED"
unit_27@specific_themes$heatmap$color$mid <- "#FC8E58"
unit_27@specific_themes$heatmap$color$max <- "#800000"