Introduction
The function of DATASET_SYMBOL is to display various
symbol shapes directly on the branches of the tree. The
DATASET_GRADIENT template belongs to the “Basic graphics”
class (refer to the Class for detail information).
Users typically add symbols to branches of a tree by inputting the branch names or nodes, as well as specifying the symbol’s size, color, fill, and position.
This section describes how to use itol.toolkit to add symbols to branches of a tree. Without itol.toolkit, users have to set a lot of information manually, such as the size and the location of each symbol. The itol.toolkit automatically configures the size, shape, and color of symbols and adjust the size of all symbols globally.
Draw symbols
This section uses dataset 1 as an example to demonstrate adding symbols to branches of a tree based on metadata information. (refer to the Dataset for detail information)
Load data
The first step is to load the newick format tree file
tree_of_itol_templates.tree and its corresponding metadata
template_parameters_count and
template_groups.
The following sample file template_parameters_count
contains contains style parameters and data parameter information for
the template type, with each column being a parameter. A value of 1
indicates that the template uses this parameter, while a value of 0
indicates that it is not used. And the sample file
template_groups.txt is the category information for the
template, the first column is the template name, and the second column
is the category information.
The purpose of our data processing in this section is to display the number of parameters used by each template by adding symbols to the branches of the tree. The more parameters a template uses, the larger the symbol.
library(itol.toolkit)
library(data.table)
library(ape)
tree <- system.file("extdata",
                    "tree_of_itol_templates.tree",
                    package = "itol.toolkit")
data("template_groups")
data("template_parameters_count")
tree <- read.tree(tree)
We can use different symbols for different groups. The program will
automatically identify and set different colors and symbol shapes based
on group information in template_groups. When the number of
groups exceeds 6, the program will use different colors shapes to
distinguish different groups automatically.
template_parameters_count <- data.frame(template_parameters_count)
df_data <- cbind(template_groups,as.data.frame(rowSums(template_parameters_count)))
unit_30 <- create_unit(data = df_data,
                    key = "E030_symbol_1",
                    type = "DATASET_SYMBOL",
                    position = 1,
                    tree = tree)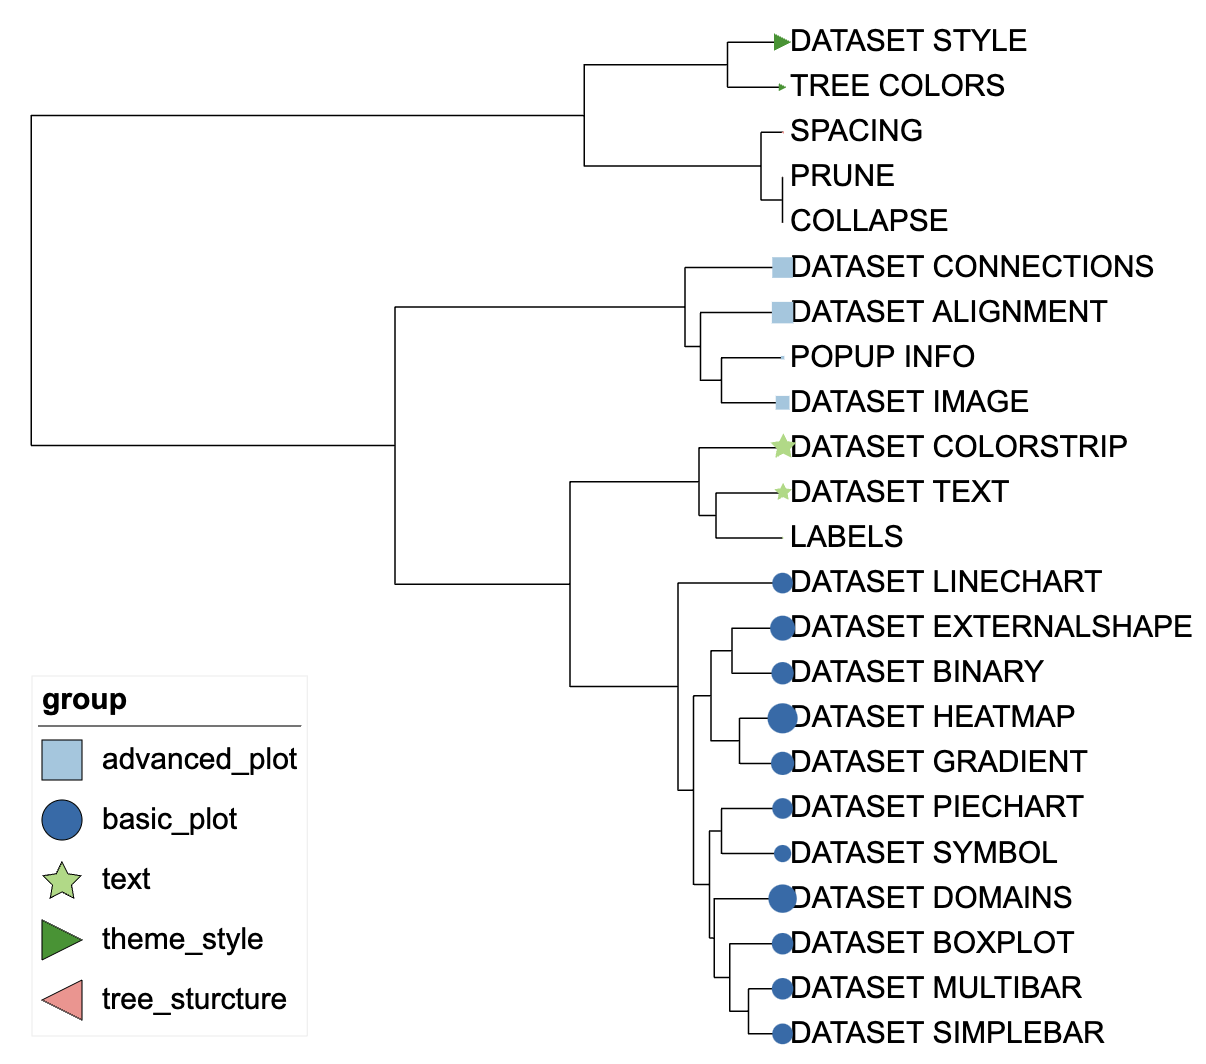
Symbol visualization example 1
We can use the “position” parameter to set the position where the symbol appears.Position should be a number between 0 and 1, specifying the ratio of the branch length where the center of the symbol should be positioned. Here, we set the position to 0.5 to place the symbol in the middle of the branch.
unit_31 <- create_unit(data = df_data,
                    key = "E031_symbol_2",
                    type = "DATASET_SYMBOL",
                    position = 0.5,
                    tree = tree)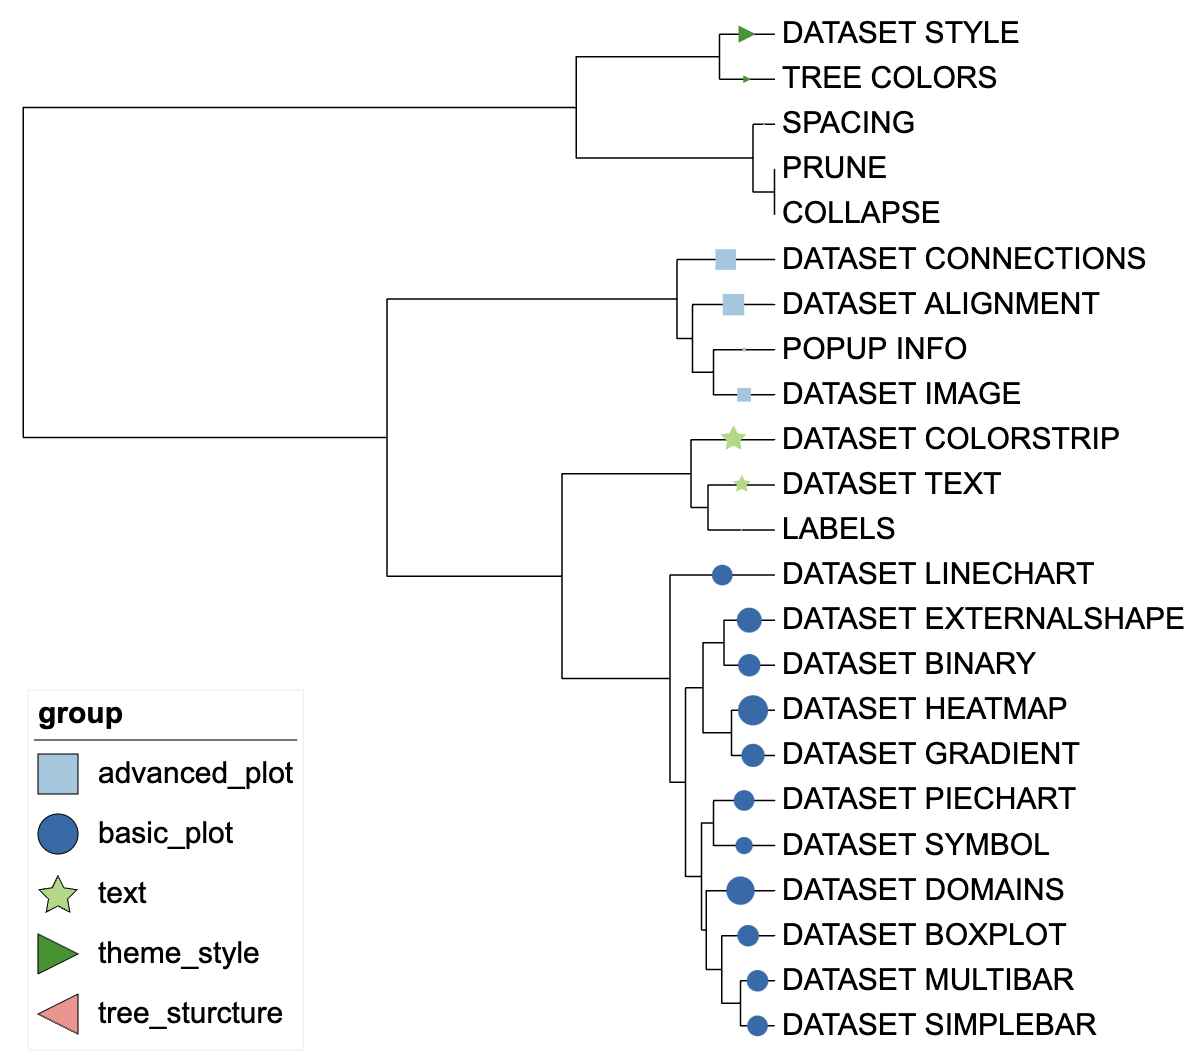
Symbol visualization example 2
We can determine whether the symbol is filled by changing the
fill parameter. 0 represents a outlined symbol, and 1
represents a filled symbol.
unit_32 <- create_unit(data = df_data,
                    key = "E032_symbol_3",
                    type = "DATASET_SYMBOL",
                    position = 0.5,
                    tree = tree,
                    fill = 0)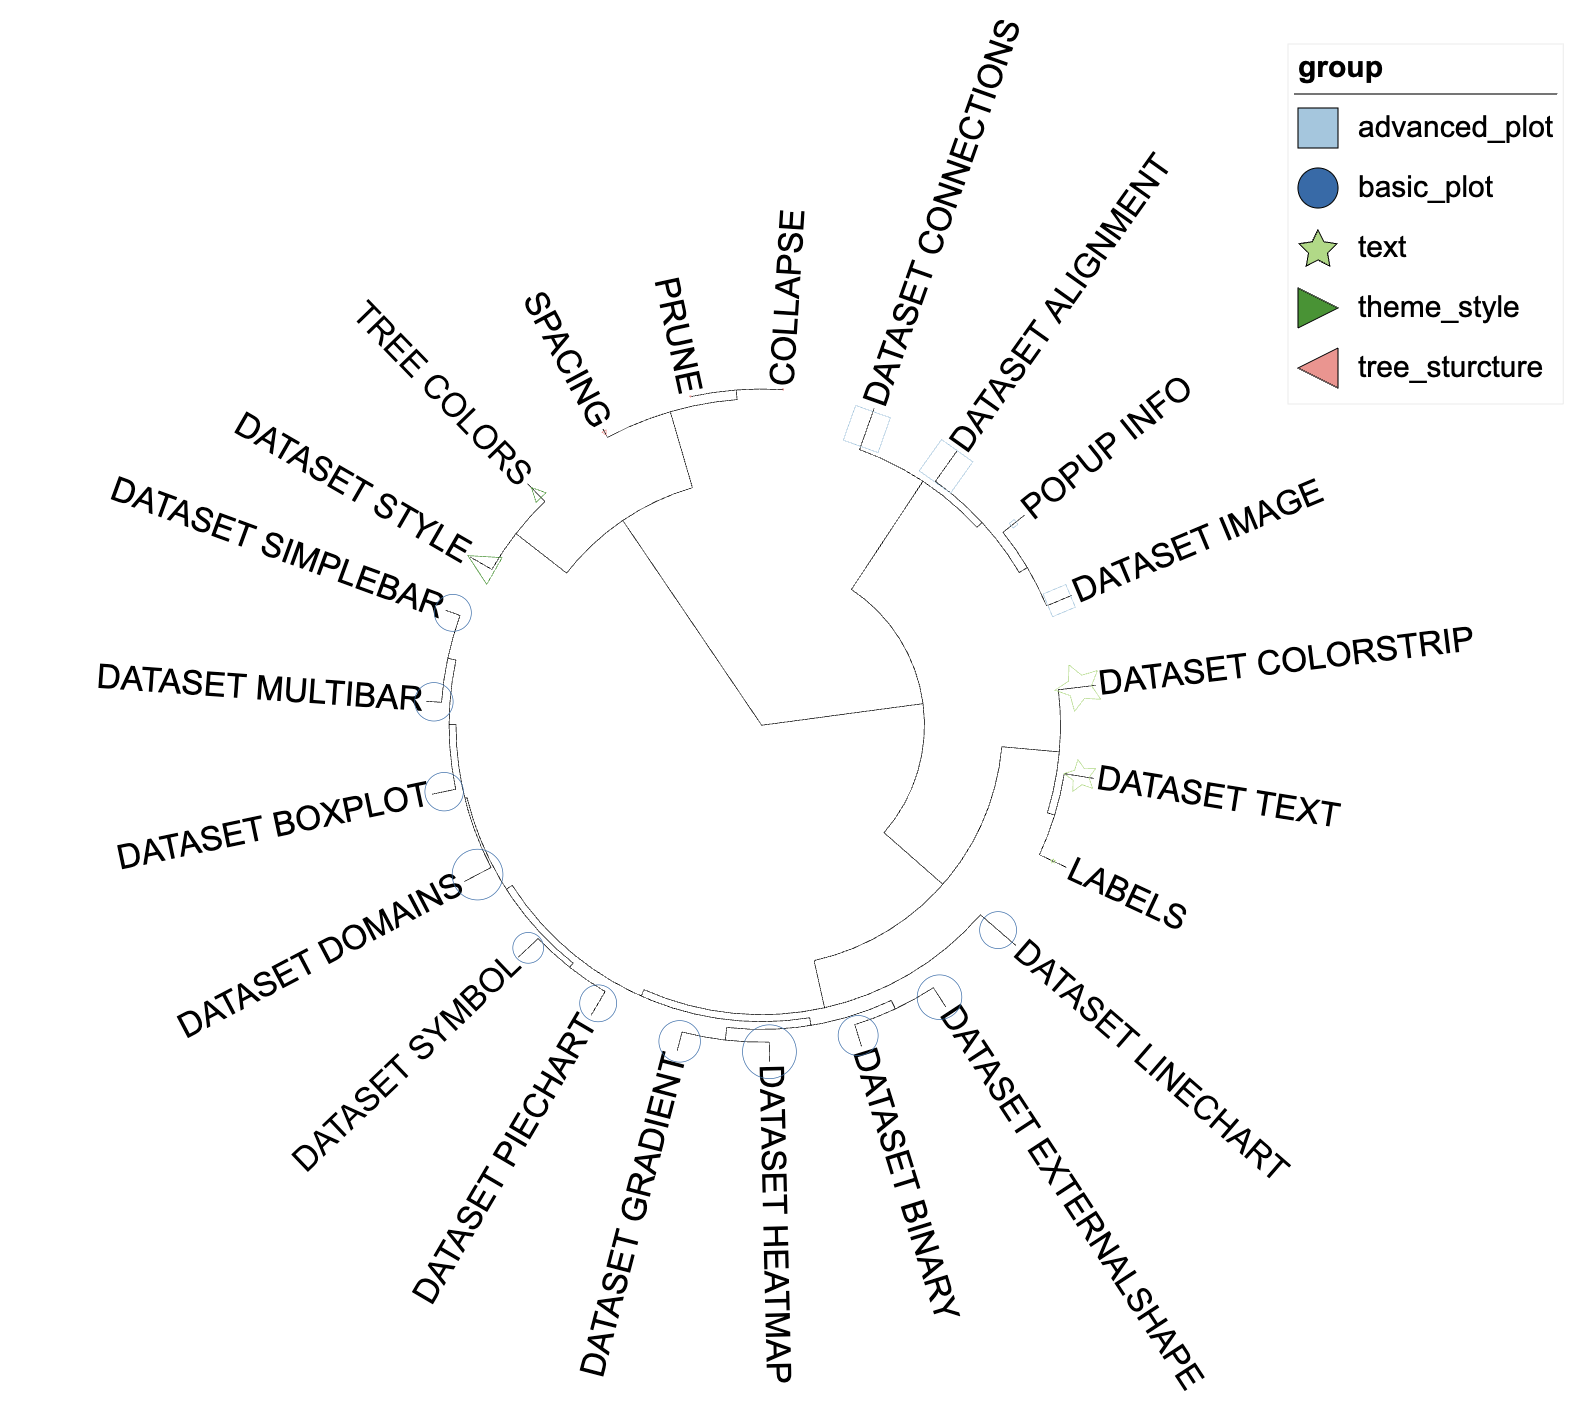
Symbol visualization example 3