DATASET_MULTIBAR
Longzhao Li1, Zhongyi Hua2, Tong Zhou3
Last compiled on 01 September, 2025
DATASET_MULTIBAR.RmdIntroduction
The function of DATASET_MULTIBAR is to prepare templates
for drawing multi-value bar charts. In multibar charts, each tip node is
associated to multiple numeric values, which are displayed as a stacked
or aligned bar chart outside the tree. The DATASET_MULTIBAR
template belongs to the “Basic graphics” class (refer to the Class for detail information).
In multibar charts, individual fields (values) require corresponding labels and colors that are defined using “FIELD_LABELS” and “FIELD_COLOR” lines in the template. Additionally, these values are typically statistics derived from raw data, such as the average and sum. Unfortunately, iTOL does not support statistical analysis, making it necessary for users to use other tools to perform such analysis. Additionally, the raw data was excluded in iTOL templates, posing difficulties in reproducing figures or sharing them with others.
Here, we provide a convenient way to calculate
statistics for multibar charts and store
FIELD_LABELS and FIELD_COLOR values. This
section describes how to use itol.toolkit to prepare the
multi-value bar charts templates.
Plot multibar plot
This section uses dataset 1 as an example to show how to draw the multibar charts. (refer to the Dataset for detail information)
Load data
The first step is to load the newick format tree file
tree_of_itol_templates.tree and its corresponding metadata
df_frequence.
library(itol.toolkit)
library(data.table)
library(tidyr)
library(dplyr)
library(stringr)
library(ape)
tree <- system.file("extdata",
                    "tree_of_itol_templates.tree",
                    package = "itol.toolkit")
df_frequence <- system.file("extdata",
                            "templates_frequence.txt",
                             package = "itol.toolkit")
df_frequence <- data.table::fread(df_frequence)
names(df_frequence) <- c(
  "id",
  "Li,S. et al. (2022) J. Hazard. Mater.","Zheng,L. et al. (2022) Environ. Pollut.",
  "Welter,D.K. et al. (2021) mSystems",
  "Zhang,L et al. (2022) Nat. Commun.",
  "Rubbens,P. et al. (2019) mSystems",
  "Laidoudi,Y. et al. (2022) Pathogens",
  "Wang,Y. et al. (2022) Nat. Commun.",
  "Ceres,K.M. et al. (2022) Microb. Genomics",
  "Youngblut,N.D. et al. (2019) Nat. Commun.",
  "Balvín,O. et al. (2018) Sci. Rep.",
  "Prostak,S.M. et al. (2021) Curr. Biol.",
  "Dijkhuizen,L.W. et al. (2021) Front. Plant Sci.",
  "Zhang,X. et al. (2022) Microbiol. Spectr.",
  "Peris,D. et al. (2022) PLOS Genet.",
  "Denamur,E. et al. (2022) PLOS Genet.",
  "Dezordi,F.Z. et al. (2022) bioRxiv",
  "Lin,Y. et al. (2021) Microbiome",
  "Wang,Y. et al. (2022) bioRxiv",
  "Qi,Z. et al. (2022) Food Control",
  "Zhou,X. et al. (2022) Food Res. Int.",
  "Zhou,X. et al. (2022) Nat. Commun.")
names(df_frequence) <- stringr::str_remove_all(names(df_frequence),"[()]")
names(df_frequence) <- stringr::str_replace_all(names(df_frequence),",","-")
Data processing and create the unit
Convert wide data to long data. After conversion, the input data fed
to DATASET_MULTIBAR should have at least two columns: The
first column is tip id and the other should contain the values to plot.
The itol.toolkit will automatically assigned
FIELD_LABELSby columns names and FIELD_COLORS
by the palette.
df_frequence_years <- df_frequence %>%
   pivot_longer(-id)%>%
   na.omit() %>%
   mutate(years = str_extract(name,"\\d{4}")) %>%
   group_by(id,years) %>%
   summarise(value = sum(value)) %>%
   spread(years,value) %>%
   replace(is.na(.), 0)
unit_37 <- create_unit(data = df_frequence_years,
                    key = "E037_simplebar_2",
                    type = "DATASET_MULTIBAR",
                    tree = tree)
write_unit(unit_37)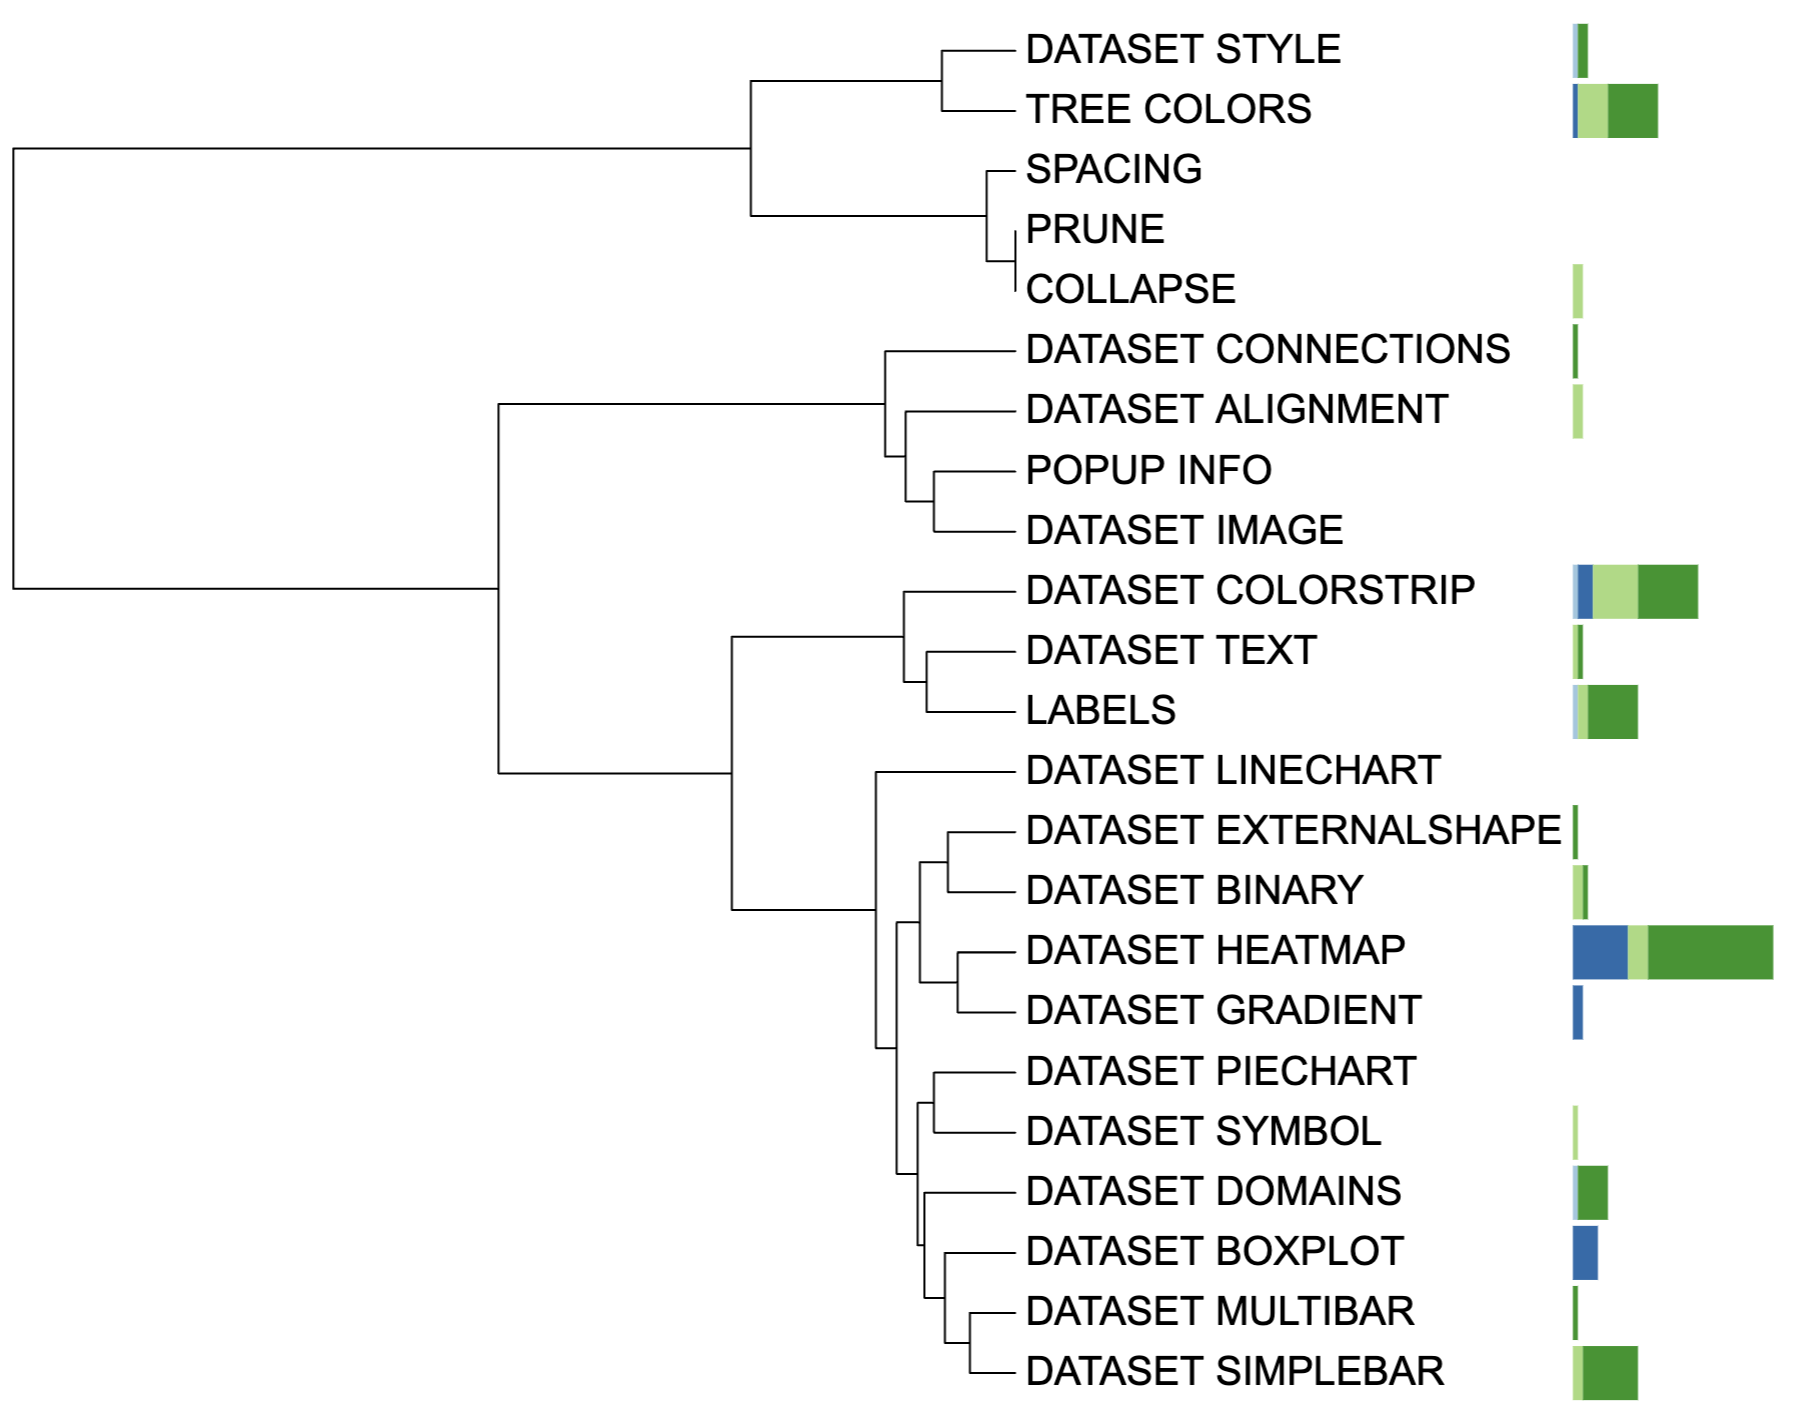
Multibar chart visualization example