DATASET_COLORSTRIP
Weiyue Liu1, Zhongyi Hua2, Tong Zhou3
Last compiled on 01 September, 2025
DATASET_COLORSTRIP.RmdIntroduction
The function of DATASET_COLORSTRIP template is to
generate corresponding color strips outside the tree for specified tips.
The DATASET_COLORSTRIP template belongs to the “Text” class
(refer to the Class for detail information).
Typically, users add colored strips by entering branch names or nodes, colors (RGB, RGBA, or hexadecimal format), and labels.
This section shows how to use itol.toolkit to add color strips outside the tree. Without itol.toolkit, users need to manually input colors one by one. This process will be very cumbersome if there are many tips. With the help of itol.toolkit, users only need to import metadata, and the program will automatically generate color information for each tip, greatly improving the efficiency of data processing.
General process
This section uses dataset 1 and dataset 3 as examples to show adding color strips for trees of different sizes (refer to the Dataset for detail information). Users can download the data locally from the provided link above. The files are read using a relative path in this document, so please adjust the path based on actual situation.
Dataset 1
The first step is to load the newick format tree file
tree_of_itol_templates.tree and its corresponding metadata
template_groups.
The purpose of this part is to add different colored strips for different types of templates.
library(itol.toolkit)
library(data.table)
library(ape)
tree_1 <- system.file("extdata",
                      "tree_of_itol_templates.tree",
                       package = "itol.toolkit")
data("template_groups")
The input data for DATASET_COLORSTRIP contains two
columns: The first column is the leaf node name and the second is the
group name.We can add color strips to the tips by entering the branch
name.
unit_21 <- create_unit(data = template_groups,
                       key = "E021_color_strip_1",
                       type = "DATASET_COLORSTRIP",
                       tree = tree_1)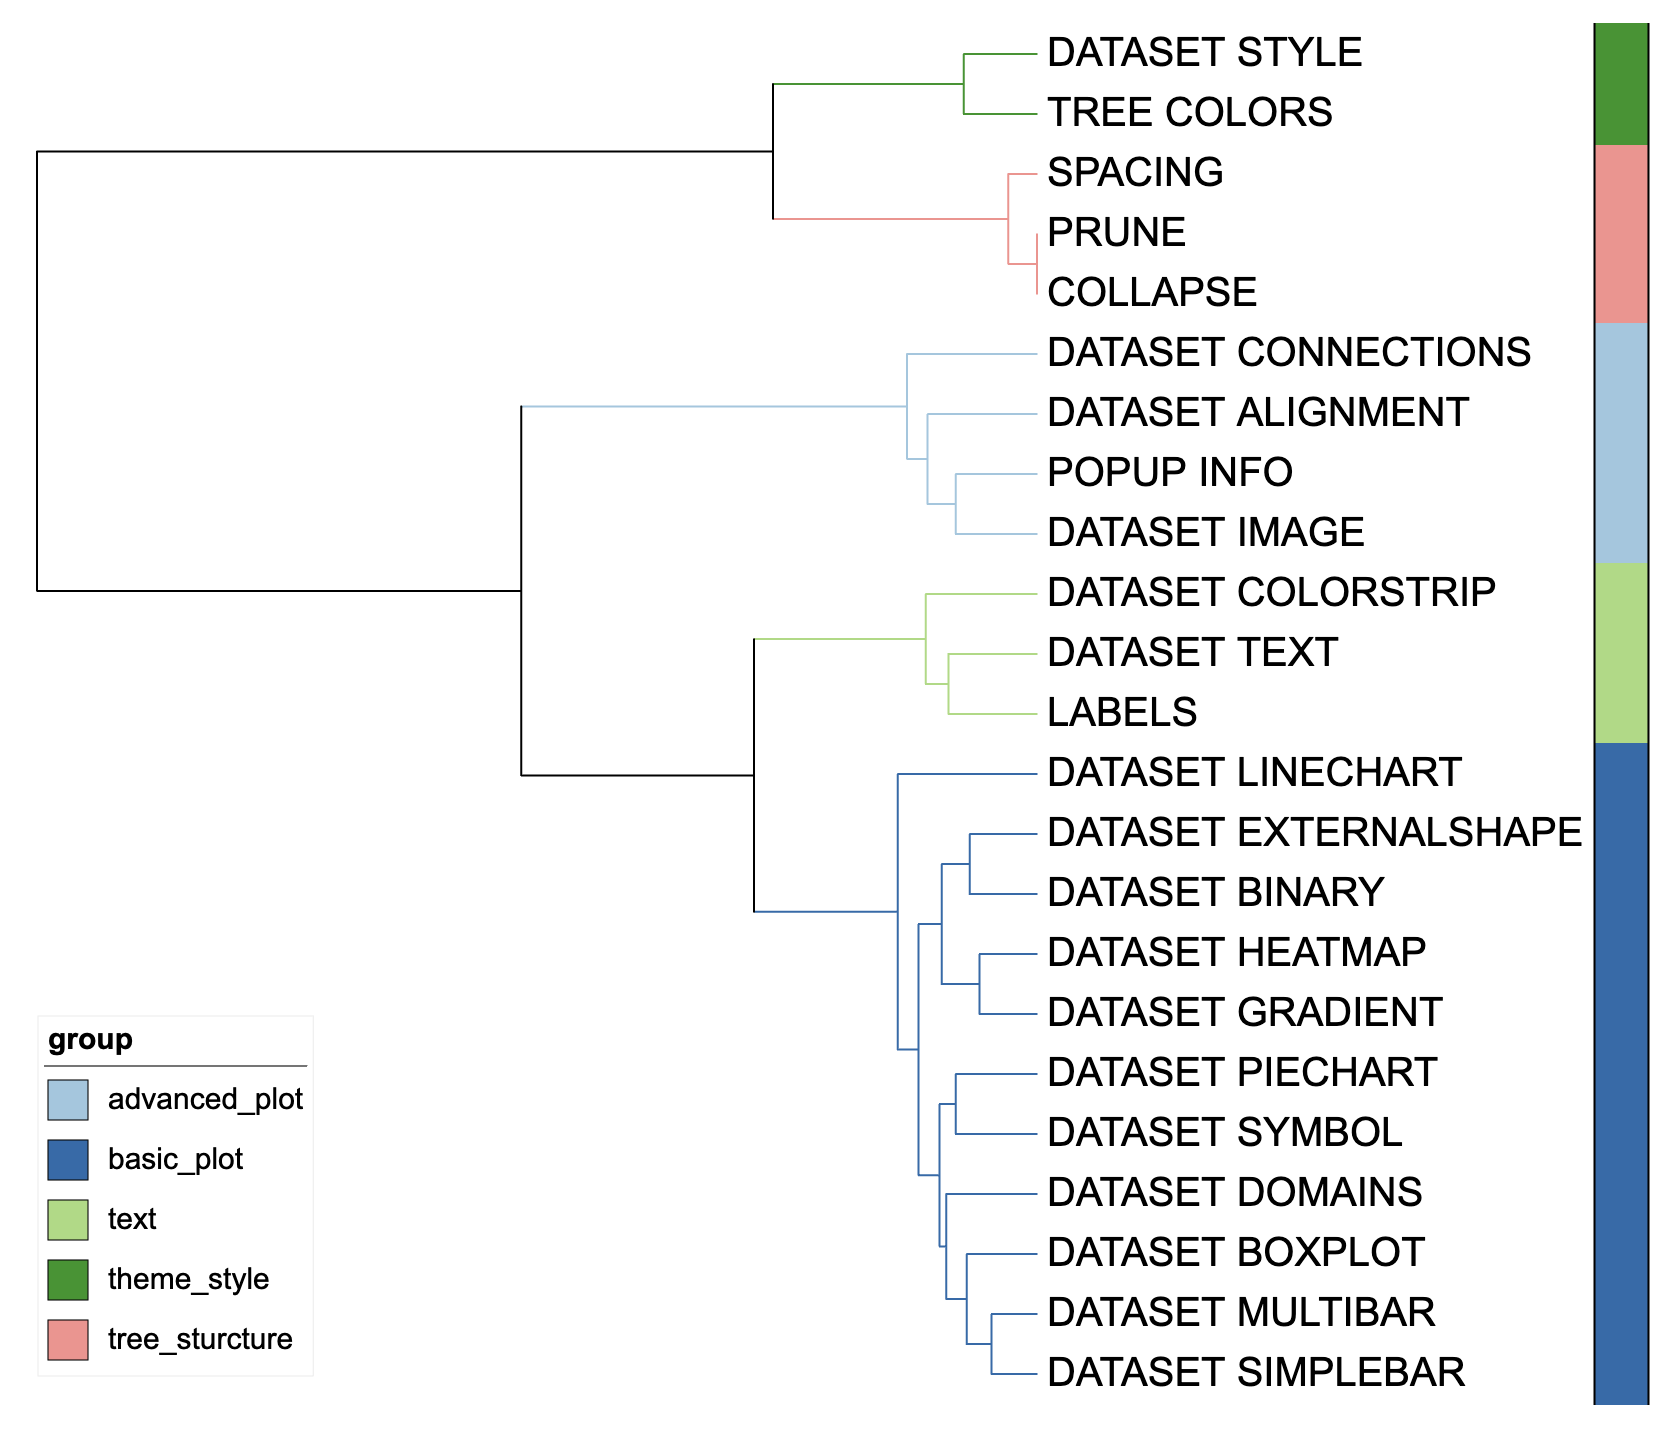
Color strip visualization example 1
Color strips can also be added through nodes.
df_data <- data.frame(id = c("tree_sturcture", "theme_style", "text", "basic_plot", "advanced_plot"),
                      data = c("tree_sturcture", "theme_style", "text", "basic_plot", "advanced_plot"))
unit_22 <- create_unit(data = df_data,
                       key = "E022_color_strip_2",
                       type = "DATASET_COLORSTRIP",
                       tree = tree_1)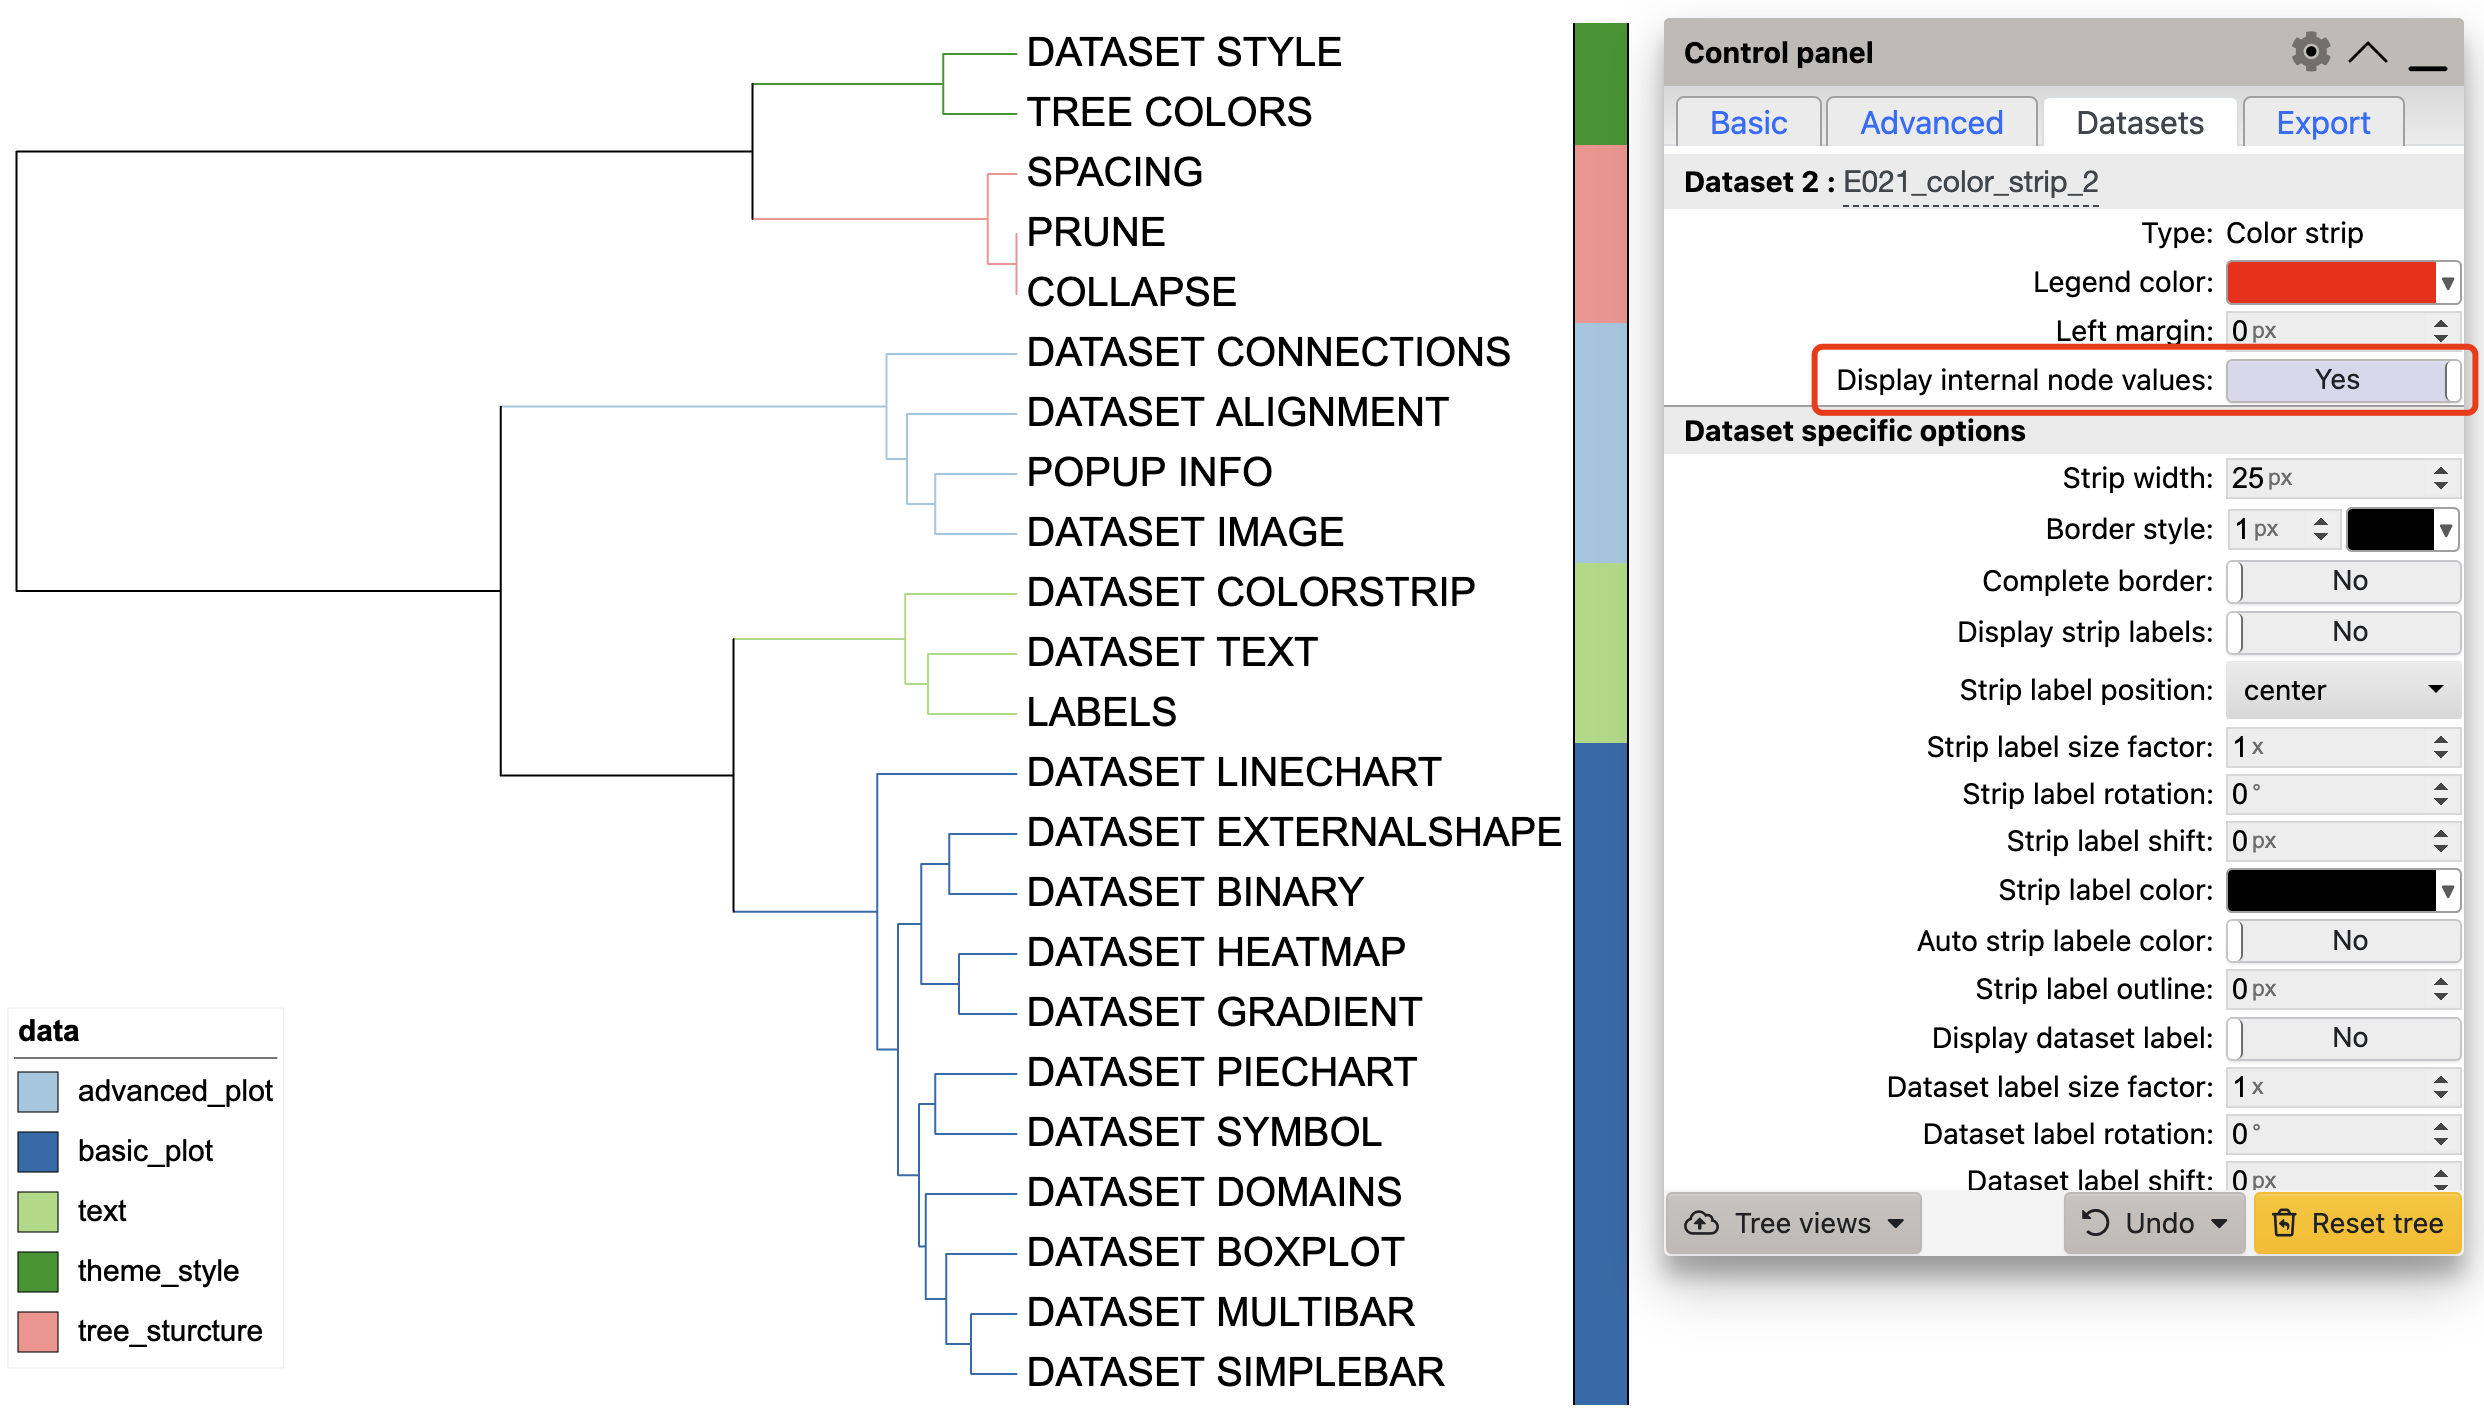
Color strip visualization example 2
It is worth noting that when adding a color strip through node, the
color strip is not displayed outside the tree by default, and can be
displayed by turning on Display internal node values on the
iTOL control panel. At the same time, users can display labels through
Display strip labels on the iTOL control panel.
Dataset 3
In actual use, there may be a large number of groups entered by
users, which may exceed the number of color plates in some R packages.
In itol.toolkit, automatic generation of up to 75 colors is supported.
Tree file rare-tree.nwk is a large tree composed of rare
OTUs. The rare-metadata.txt file stores the abundance
information and taxonomy information of rare OTUs. The purpose of this
part is to display taxonomy information at class level of each OTUs
through color strips.
library(itol.toolkit)
library(data.table)
library(ape)
library(dplyr)
# Users need to `setwd()` to the directory containing dataset3
tree_2 <- read.tree("rare-tree.nwk")
df_metadata <- fread("rare-metadata.txt")
Filter the taxonomy information of class in the metadata and generate color strips based on it.
unit_23 <- create_unit(data = df_metadata %>%
                        select(ID, Class),
                      key = "Zheng2022ep_3al_3_strip",
                      type = "DATASET_COLORSTRIP",
                      color = "wesanderson",
                      tree = tree_2)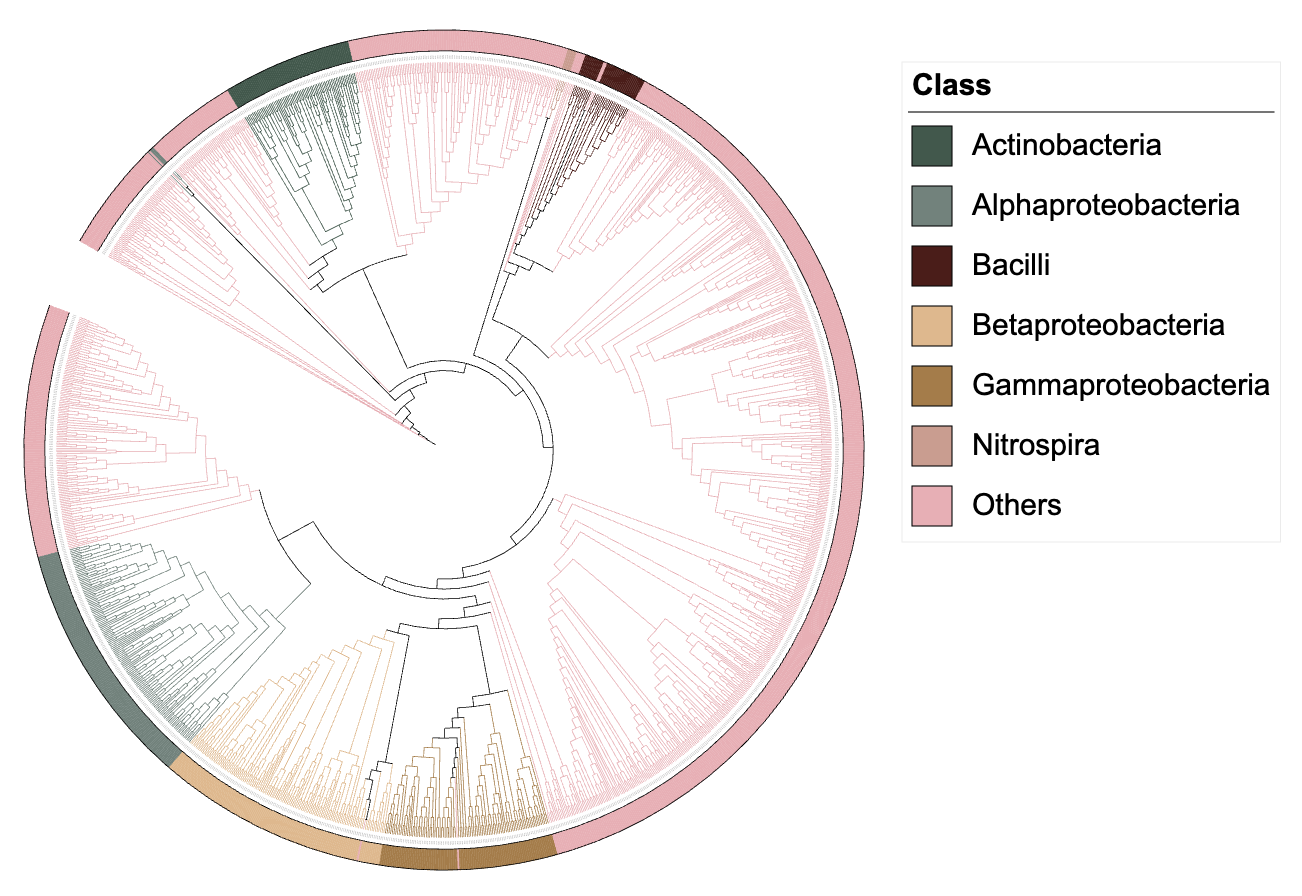
Color strip visualization example 3
It should be noted that when the tree is large or there are too many annotation information dimensions, it may cause the browser to crash. You should choose another browser or close the browser tab at this time.