DATASET_PIECHART
Longzhao Li1, Zhongyi Hua2, Tong Zhou3
Last compiled on 01 September, 2025
DATASET_PIECHART.RmdIntroduction
The function of DATASET_PIECHART is to draw the pie
chart and store drawing information. The DATASET_PIECHART
template belongs to the “Basic graphics” class (refer to the Class for detail information).
Typically, users cannot save drawing information using iTOL, making reproduce pictures or share them with others difficultly. Here, we provide a convenient way to store radius and the proportion of different groups of pip charts. This section describes how to itol.toolkit to draw the pie chart and store corresponding information.
General process
This section uses dataset 1 as an example to show how to draw the line chart. (refer to the Dataset for detail information)
Load data
The first step is to load the newick format tree file
tree_of_itol_templates.tree and its corresponding metadata
df_frequence.
library(itol.toolkit)
library(data.table)
library(tidyr)
library(dplyr)
library(stringr)
library(ape)
tree <- system.file("extdata",
                    "tree_of_itol_templates.tree",
                    package = "itol.toolkit")
df_frequence <- system.file("extdata",
                            "templates_frequence.txt",
                             package = "itol.toolkit")
df_frequence <- fread(df_frequence)
names(df_frequence) <- c(
  "id",
  "Li,S. et al. (2022) J. Hazard. Mater.","Zheng,L. et al. (2022) Environ. Pollut.",
  "Welter,D.K. et al. (2021) mSystems",
  "Zhang,L et al. (2022) Nat. Commun.",
  "Rubbens,P. et al. (2019) mSystems",
  "Laidoudi,Y. et al. (2022) Pathogens",
  "Wang,Y. et al. (2022) Nat. Commun.",
  "Ceres,K.M. et al. (2022) Microb. Genomics",
  "Youngblut,N.D. et al. (2019) Nat. Commun.",
  "Balvín,O. et al. (2018) Sci. Rep.",
  "Prostak,S.M. et al. (2021) Curr. Biol.",
  "Dijkhuizen,L.W. et al. (2021) Front. Plant Sci.",
  "Zhang,X. et al. (2022) Microbiol. Spectr.",
  "Peris,D. et al. (2022) PLOS Genet.",
  "Denamur,E. et al. (2022) PLOS Genet.",
  "Dezordi,F.Z. et al. (2022) bioRxiv",
  "Lin,Y. et al. (2021) Microbiome",
  "Wang,Y. et al. (2022) bioRxiv",
  "Qi,Z. et al. (2022) Food Control",
  "Zhou,X. et al. (2022) Food Res. Int.",
  "Zhou,X. et al. (2022) Nat. Commun.")
names(df_frequence) <- stringr::str_remove_all(names(df_frequence),"[()]")
names(df_frequence) <- stringr::str_replace_all(names(df_frequence),",","-")
Data processing and create the unit
Convert wide data to long data. After conversion, the input data fed
to DATASET_PIECHART should have at least two columns: tree
tip id and the radius. If there are more than two columns, If there are
more than two columns, the proportion of different groups starts from
the third column. The column name is the group name.
df_frequence_years <- df_frequence %>%
  pivot_longer(-id)%>%
  mutate(years = str_extract(name,"\\d{4}")) %>%
  replace(is.na(.), 0) %>%
  group_by(id,years) %>%
  summarise(value = sum(value)) %>%
  spread(years,value) %>%
  replace(is.na(.), 0) %>%
  mutate(size = log(sum(`2018`,`2019`, `2021`, `2022`)+2)) %>%
  relocate(size, .after = id)
unit_41 <- create_unit(data = df_frequence_years,
                    key = "E041_piechart_1",
                    type = "DATASET_PIECHART",
                    position = 0,
                    tree = tree)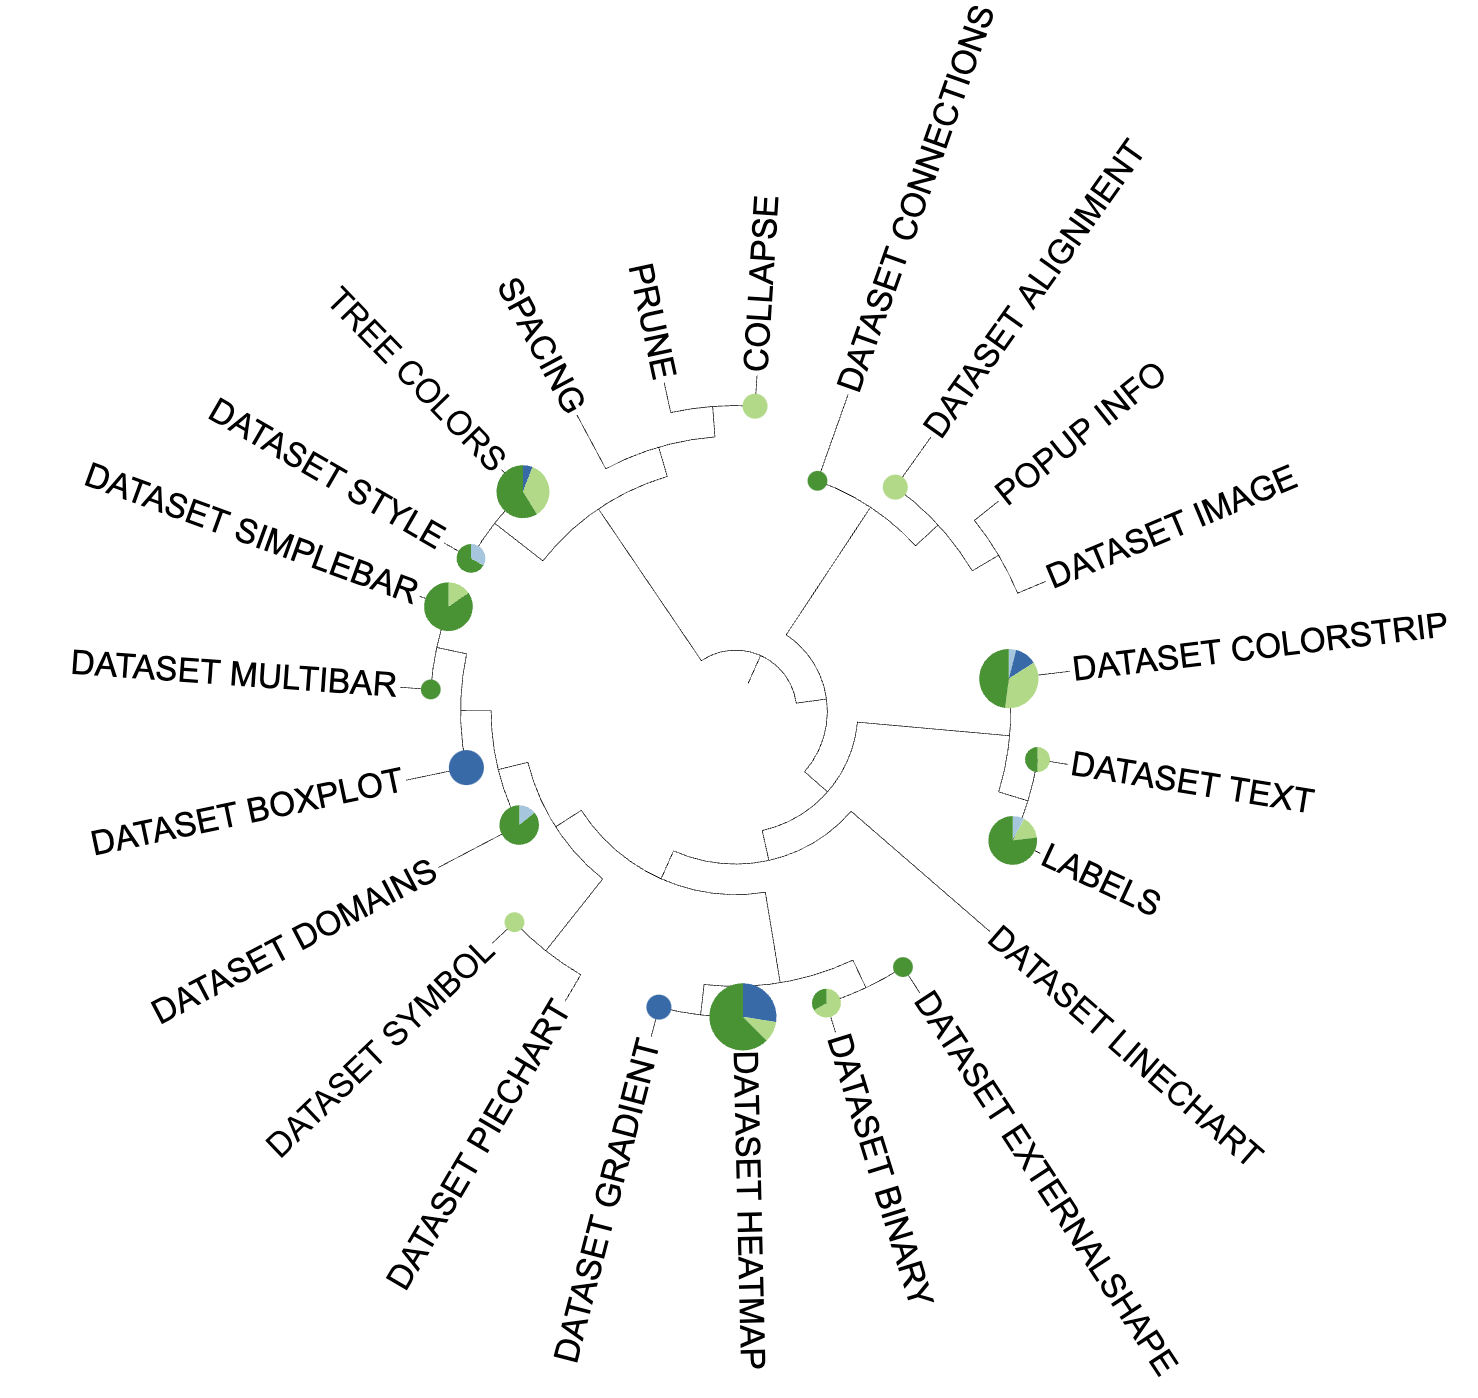
Pie chart visualization example