DATASET_CONNECTIONS
Weiyue Liu1, Zhongyi Hua2, Tong Zhou3
Last compiled on 01 September, 2025
DATASET_CONNECTIONS.RmdIntroduction
The function of the DATASET_CONNECTION template is to
draw a line or curve between any two nodes in the tree. Users can
customize the appearance of each connection by setting its width, color,
style (normal or dashed), and opacity. Additionally, arrowheads can be
displayed to indicate the direction of the connection lines. The
DATASET_CONNECTION template belongs to the “Advanced
graphics” class (refer to the Class for detail
information).
The nodes are connected by the user through inputting their IDs and specifying the line width, color, style, and label. Without itol.toolkit, the user would have to set the appearance of each connection separately, resulting in a difficult data preparation process for visualization. The itol.toolkit provides consistency to the workflow, enabling the user to perform data processing and visualization preparation seamlessly.The user only needs to input the two nodes being connected, line width, and label text. The program will automatically generate color information, thereby increasing the efficiency of visualization preparation.
Connection Visualization
This section provides an example of how to draw a connection diagram using dataset 1 (refer to the Dataset for detail information) document for detailed information).
The first step is to load the newick format tree file
tree_of_itol_templates.tree and its corresponding metadata
parameter_groups.txt, template_groups.txt. The
parameter_groups.txt file contains the set of each
parameter and the parameters contained in each template. The
template_groups.txt file contains which class each template
belongs to.
library(itol.toolkit)
library(data.table)
library(dplyr)
library(tidyr)
tree <- system.file("extdata",
                    "tree_of_itol_templates.tree",
                    package = "itol.toolkit")
parameter_groups <- system.file("extdata",
                                "parameter_groups.txt",
                                package = "itol.toolkit")
parameter_groups <- fread(parameter_groups)
data("template_groups")
The table used to create the connection should have four columns. The
first two columns for the connected points, the third column for the
line width, and the fourth column for the labels. In practice, the user
needs to prepare the input data according to this format. Here, we
simulate the connection between templates by the parameters they
contain. The template is stored in the variable
tab_tmp_connect
tab_tmp_connect <- parameter_groups[-1, -c(1,2)] %>%
                   convert_01() %>%
                   convert_01_to_connect()
tab_tmp_connect$val <- tab_tmp_connect$val -1
tab_tmp_connect <- full_join(tab_tmp_connect,
                             template_groups,
                             by=c("row" = "template"))
tab_tmp_connect <- tab_tmp_connect %>%
                   filter(val > 9) %>%
                   filter(row != col)
unit_43 <- create_unit(data = tab_tmp_connect,
                       key = "E043_connection_1",
                       type = "DATASET_CONNECTION",
                       tree = tree)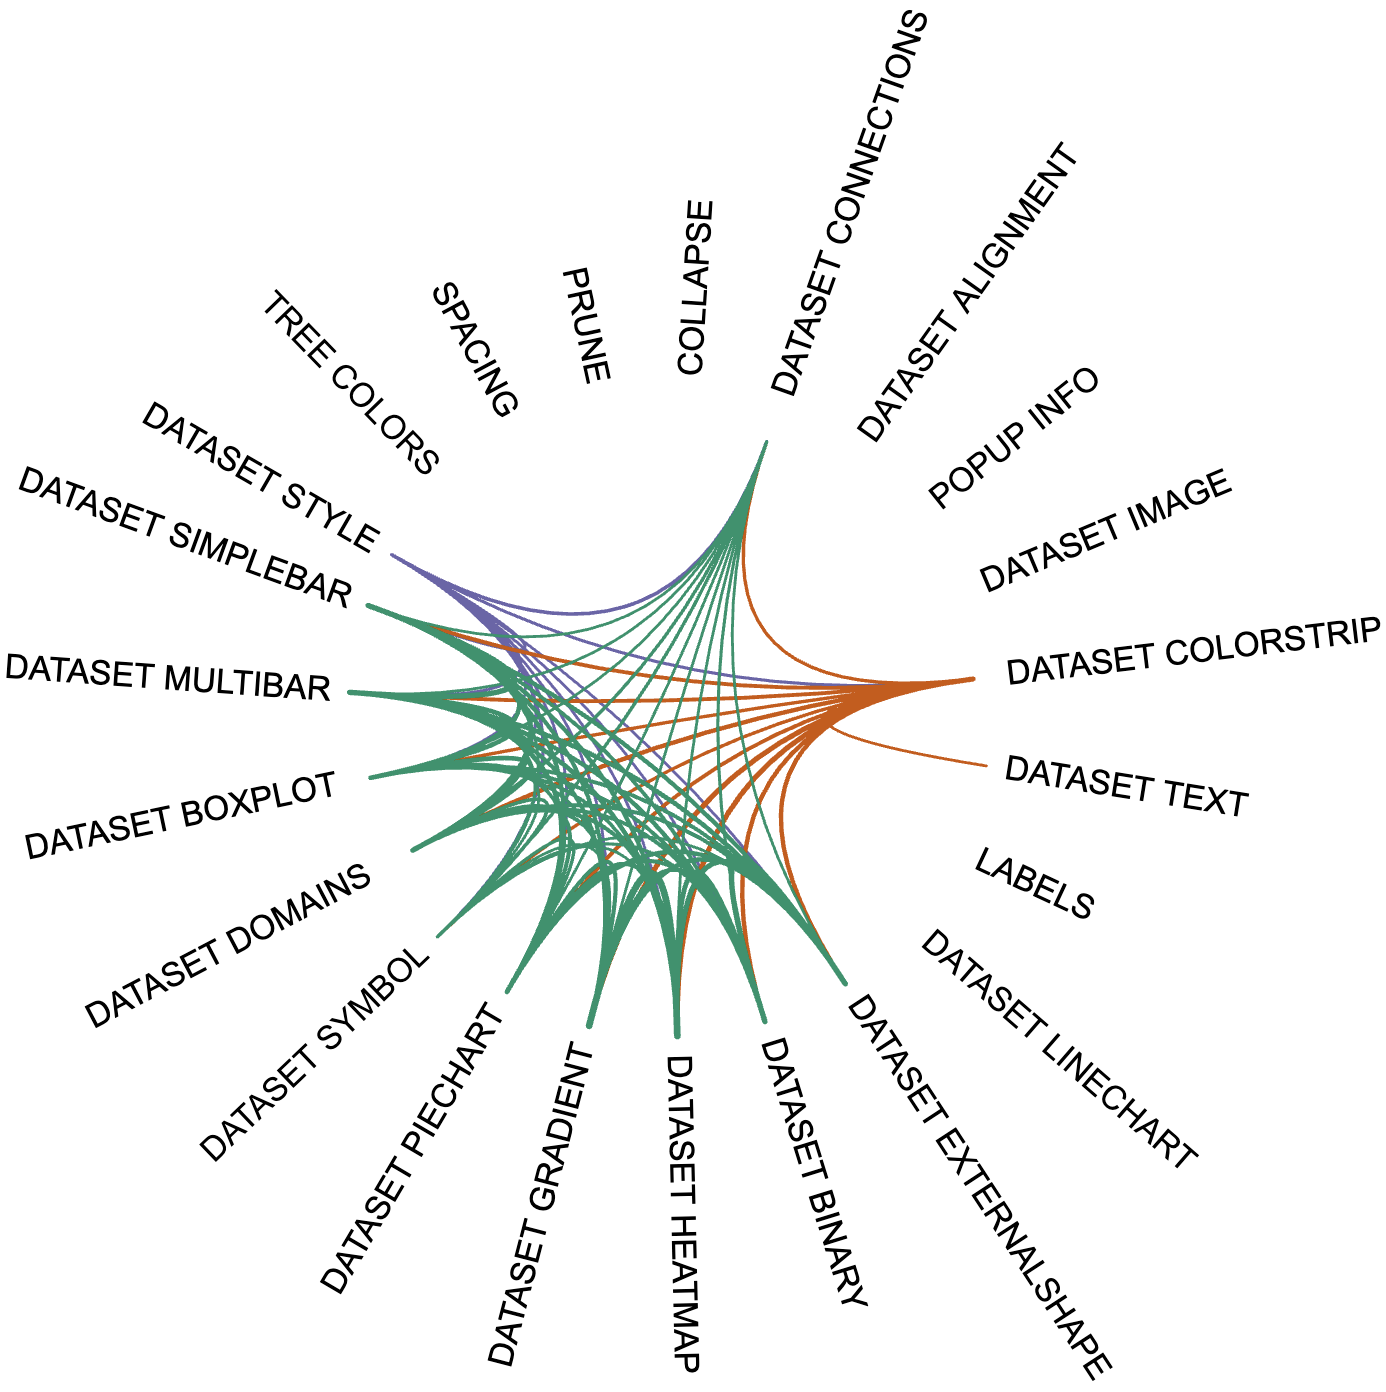
Dataset connections visualization example