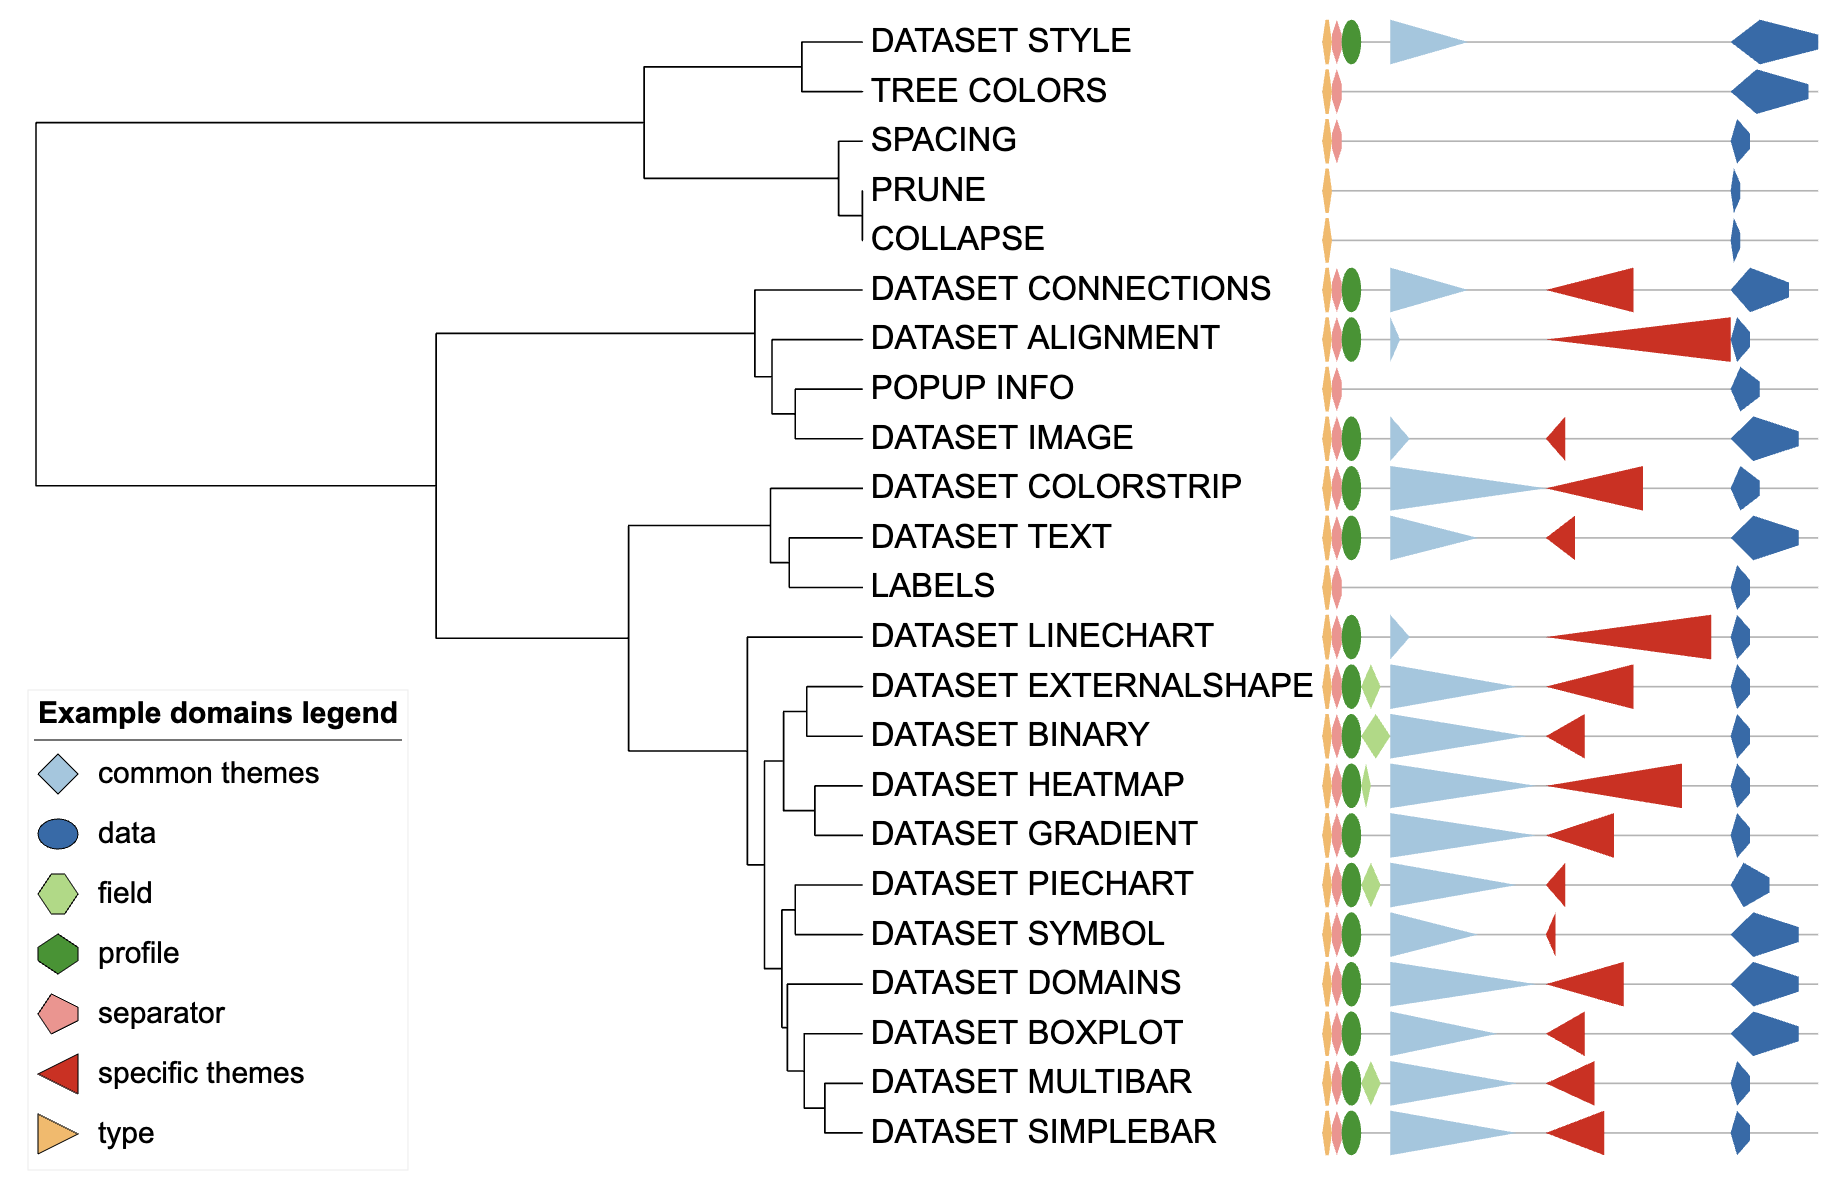
DATASET_DOMAINS
Weiyue Liu1, Zhongyi Hua2, Tong Zhou3
Last compiled on 01 September, 2025
DATASET_DOMAINS.RmdIntroduction
The DATASET_DOMAIN template are used to visualize
schematic representations of proteins, with a protein backbone and
various shapes depicting the locations of individual domains. Even
though its primary use is for the display of protein domain
architectures, it can be used for various other purposes, as it offers a
lot of flexibility. The DATASET_DOMAIN template belongs to
the “Basic graphics” class (refer to the Class for detail
information).
To add a schematic representation of a protein to its branch, users must input the branch name, protein length, marker shape, start and end position, color, and label for each structural domain.
This section shows how to use the itol.toolkit to add schematic
representations of proteins to the tree. Without
itol.toolkit, users need to manually input information such
as the color and the shape of protein domains one by one. When faced
with a large amount of data, this process is very time consuming. The
itol.toolkit simplifies the data processing procedure and integrates it
seamlessly with visual preparation. To use the itol.toolkit, users need
to prepare the label, length, start, and end position of the
corresponding protein domain for each tip, as the program automatically
sets the shape and color.
Draw schematic representation of protein
This section uses dataset 1 to show the visualization of schematic representations of proteins (refer to the Dataset for detail information).
The first step is to load the newick format tree file
tree_of_itol_templates.tree and its corresponding metadata
parameter_usage_raw.txt. The following example data
parameter_usage_raw.txt contains the types of parameters
and their usage in each template.
The purpose of our data processing in this section is to demonstrate the use of various types of parameters in various templates using schematic representation of protein.
library(itol.toolkit)
library(data.table)
library(dplyr)
library(tidyr)
tree <- system.file("extdata",
                    "tree_of_itol_templates.tree",
                    package = "itol.toolkit")
tab_tmp <- system.file("extdata",
                       "parameter_groups.txt",
                       package = "itol.toolkit")
tab_tmp <- fread(tab_tmp)
We represent protein domains using the type of parameter and
determine the length of each domain by the number of parameters used by
the template for that type. The final result of our data processing is
shown in variable template_end_group_long. The first column
is the template names (corresponding to the tips of the tree), the
second column is the length of the protein domain, the three and four
columns are the starting and ending positions of the protein domain, and
the fifth column is the parameter types (i.e., the domain label).
tab_id_group <- tab_tmp[,c(1,2)]
tab_tmp <- tab_tmp[,-c(1,2)]
tab_tmp_01 <- convert_01(object = tab_tmp)
tab_tmp_01 <- cbind(tab_id_group,tab_tmp_01)
para_order <- c("type",
                "separator",
                "profile",
                "field",
                "common themes",
                "specific themes",
                "data")
template_with_start <- tab_tmp_01 %>%
                   pivot_longer(-c('parameter', 'group'),
                                names_to = 'variable',
                                values_to = 'value') %>%
                   group_by(group,variable) %>%
                   summarise(sublen = sum(value)) %>%
                   spread(key=variable,
                          value=sublen) %>%
                   mutate(group=factor(group,levels = para_order)) %>%
                   arrange(group)
group_start <- data.frame(group = template_with_start$group,
                          Freq = apply(template_with_start[,-1], 1, max)) %>%
               mutate(start=lag(cumsum(Freq))) %>%
               mutate(start=replace_na(start, 0))
template_with_start_and_end <- sapply(as.list(template_with_start[,-1]),
                                      function(x)x + group_start$start) %>%
  as.data.frame() %>%
  mutate(group=template_with_start$group) %>%
  relocate(group) %>%
  pivot_longer(-c("group"),
               names_to = 'variable',
               values_to = "end") %>%
  left_join(group_start[c('group','start')]) %>%
  mutate(length=sum(group_start$Freq),
         group =factor(.$group, levels=para_order)) %>%
  relocate(variable, length, start, end, group)

group2shape <- tribble(
  ~group,               ~shape,
  "type",               "HH",
  "separator",          "HV",
  "profile",            "EL",
  "field",              "DI",
  "common themes",      "TR",
  "specific themes",    "TL",
  "data",               "PL"
)
template_end_group_long <- template_with_start_and_end  %>%
  left_join(group2shape)
Using prepared data to create unit
unit_34 <- create_unit(data = template_end_group_long,
                       key = "E034_domains_1",
                       type = "DATASET_DOMAINS",
                       tree = tree)
Dataset domains visualization example
Style modification
Users can add a column to the long table used to generate templates to change the shape of each protein domain. By assigning the domain label column to a new column and replace each label with a shape, you can quickly modify the shape.
Domain shape codes are as follows:
| Character | Shape |
|---|---|
| RE | rectangle |
| HH | horizontal hexagon |
| HV | vertical hexagon |
| EL | ellipse |
| DI | rhombus (diamond) |
| TR | right pointing triangle |
| TL | left pointing triangle |
| PL | left pointing pentagram |
| PR | right pointing pentagram |
| PU | up pointing pentagram |
| PD | down pointing pentagram |
| OC | octagon |
| GP | rectangle |