DATASET_LINECHART
Longzhao Li1, Zhongyi Hua2, Tong Zhou3
Last compiled on 01 September, 2025
DATASET_LINECHART.RmdIntroduction
The function of DATASET_LINECHART could draw the line
chart and store corresponding X-axis coordinates and Y-axis coordinates.
The DATASET_LINECHART template belongs to the “Basic
graphics” class (refer to the Class for detail
information).
Typically, users cannot save drawing information using iTOL, making it difficult to reproduce pictures or share them with others.
Here, itol.toolkit provides a convenient way to store X-axis and Y-axis coordinates for line charts. This section shows how to use itol.toolkit to draw the line chart and store corresponding information.
Draw line chart
This section uses dataset 1 as an example to show how to draw the line chart. (refer to the Dataset for detail information)
Load data
The first step is to load the newick format tree file
tree_of_itol_templates.tree and its corresponding metadata
df_frequence.
library(itol.toolkit)
library(data.table)
library(tidyr)
library(dplyr)
library(stringr)
library(ape)
tree <- system.file("extdata",
                    "tree_of_itol_templates.tree",
                    package = "itol.toolkit")
df_frequence <- system.file("extdata",
                            "templates_frequence.txt",
                             package = "itol.toolkit")
df_frequence <- fread(df_frequence)
names(df_frequence) <- c(
  "id",
  "Li,S. et al. (2022) J. Hazard. Mater.","Zheng,L. et al. (2022) Environ. Pollut.",
  "Welter,D.K. et al. (2021) mSystems",
  "Zhang,L et al. (2022) Nat. Commun.",
  "Rubbens,P. et al. (2019) mSystems",
  "Laidoudi,Y. et al. (2022) Pathogens",
  "Wang,Y. et al. (2022) Nat. Commun.",
  "Ceres,K.M. et al. (2022) Microb. Genomics",
  "Youngblut,N.D. et al. (2019) Nat. Commun.",
  "Balvín,O. et al. (2018) Sci. Rep.",
  "Prostak,S.M. et al. (2021) Curr. Biol.",
  "Dijkhuizen,L.W. et al. (2021) Front. Plant Sci.",
  "Zhang,X. et al. (2022) Microbiol. Spectr.",
  "Peris,D. et al. (2022) PLOS Genet.",
  "Denamur,E. et al. (2022) PLOS Genet.",
  "Dezordi,F.Z. et al. (2022) bioRxiv",
  "Lin,Y. et al. (2021) Microbiome",
  "Wang,Y. et al. (2022) bioRxiv",
  "Qi,Z. et al. (2022) Food Control",
  "Zhou,X. et al. (2022) Food Res. Int.",
  "Zhou,X. et al. (2022) Nat. Commun.")
names(df_frequence) <- stringr::str_remove_all(names(df_frequence),"[()]")
names(df_frequence) <- stringr::str_replace_all(names(df_frequence),",","-")
Data processing and create the unit
Convert wide data to long data. After conversion, the input data fed
to DATASET_LINECHART should have three columns: tree tip
id, X-axis coordinates, and Y-axis coordinates.
df_frequence_years <- df_frequence %>%
  pivot_longer(-id) %>%
  mutate(years = str_extract(name,"\\d{4}")) %>%
  replace(is.na(.), 0) %>%
  group_by(id,years) %>%
  summarise(value = sum(value)) %>%
  pivot_wider(names_from=years,values_from=value) %>%
  replace(is.na(.), 0) %>%
  pivot_longer(-id)
unit_40 <- create_unit(data = df_frequence_years,
                    key = "E040_linechart_1",
                    type = "DATASET_LINECHART",
                    tree = tree)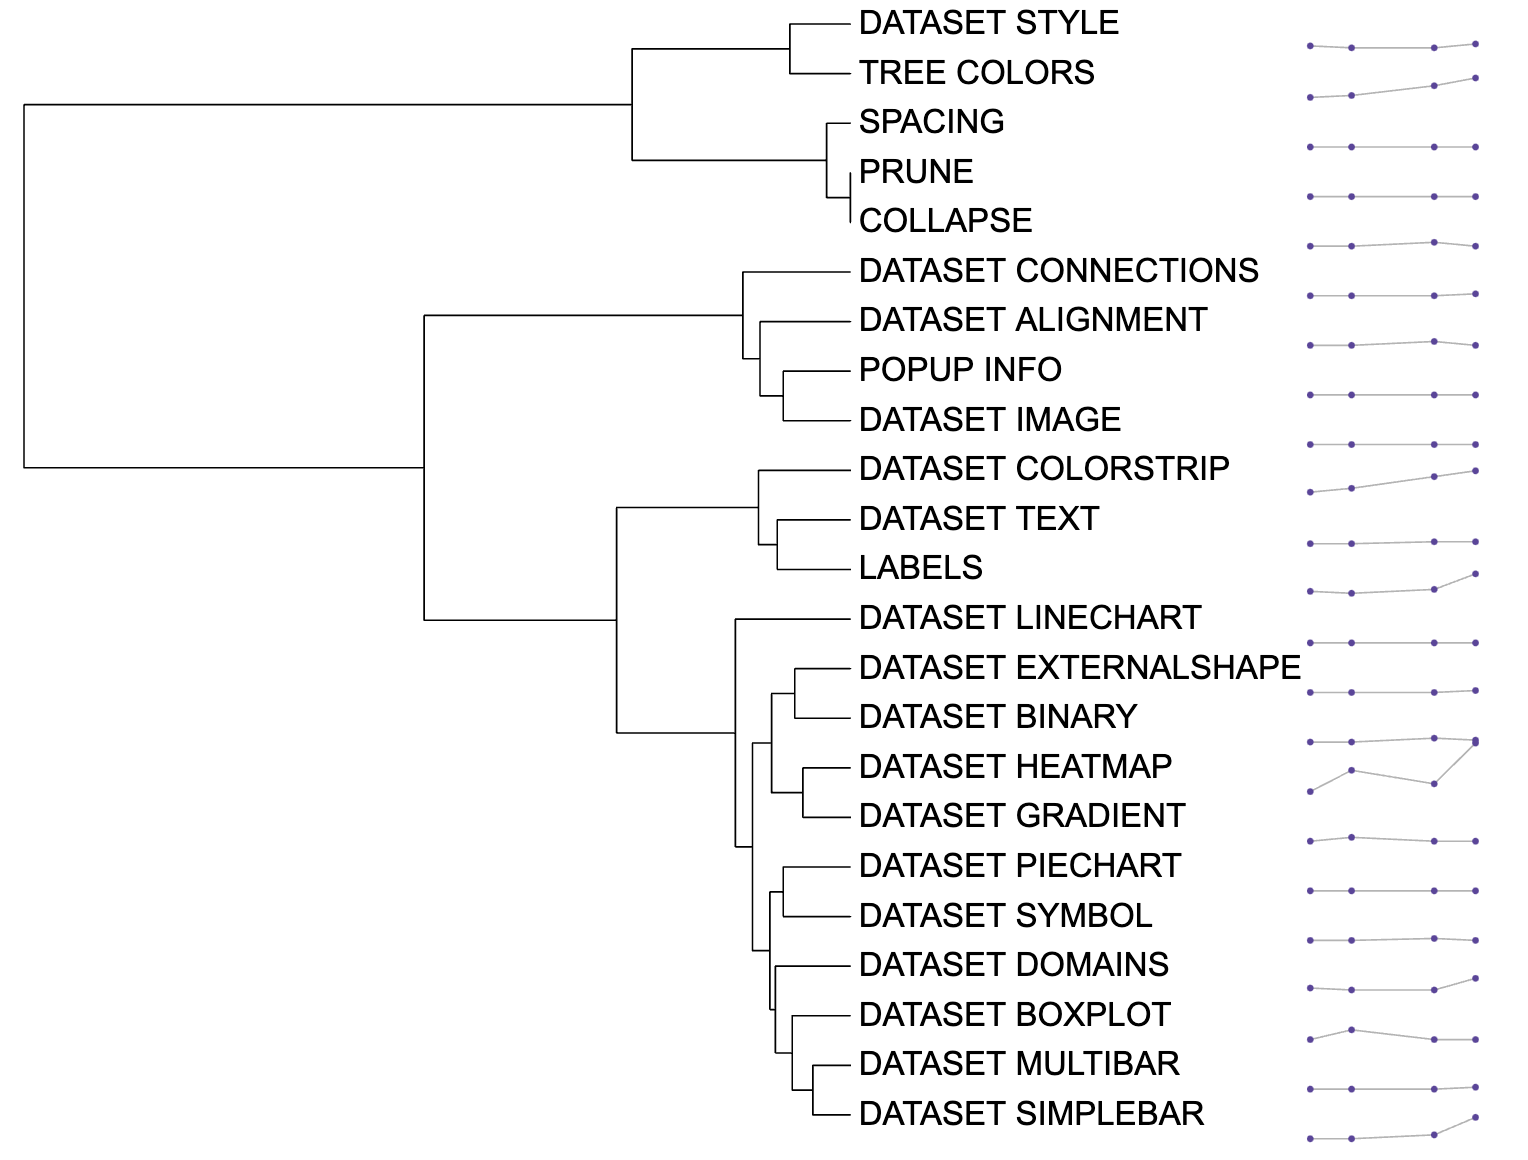
Line chart visualization example